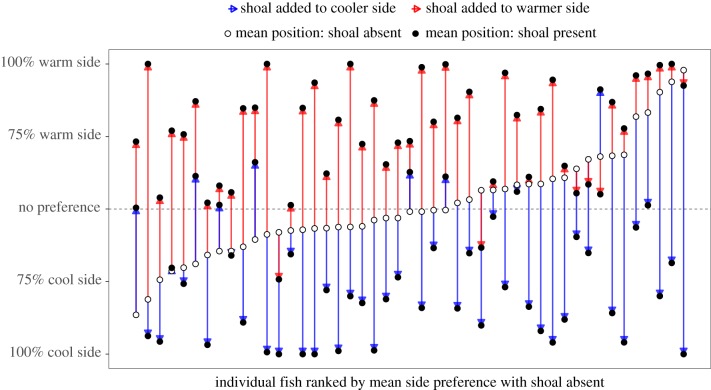
Figure 3.
Individual fish vary greatly in the degree to which they associate with conspecifics at different temperatures. White points show the fish's tank usage with no shoal, and black points show tank usage when a shoal is added. Black points connected by a red arrow to the white point represent the shift in the fish's tank usage when a shoal is added to the warmer side. Conversely, black points connected by a blue arrow to the white point represent the shift in the fish's tank usage when a shoal is added to the cooler side. Most fish tended to shift towards the shoal on either side.

