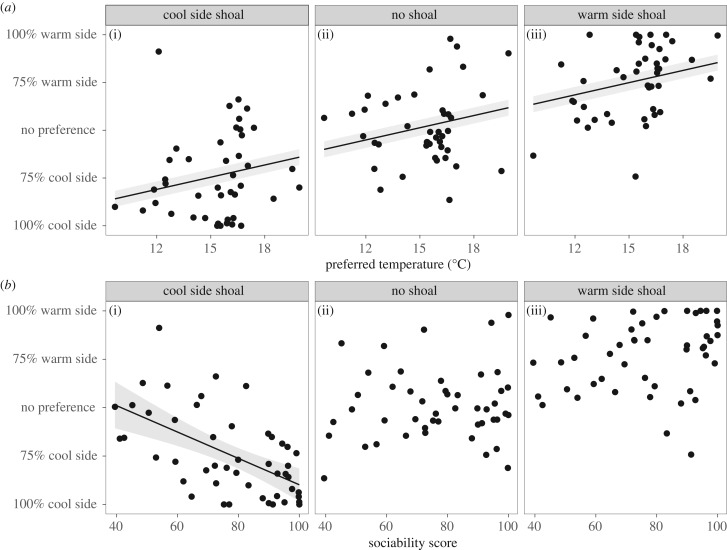
Figure 4.
(a) While individuals changed location based on the position of conspecifics, individuals with a higher temperature preference always spend more time on the warmer side (LME; F1,27 = 7.90, p = 0.009). Regression line shows the same slope for all three panels with a different intercept for each level of the ‘shoal location’ variable as part of a LME model. (b) More social fish spent more time with the shoal when it was on the cool side (LME; t2,67 = −4.74, p < 0.001), but not when the shoal was on the warm side. Lines represent significant trends based on LMEs described in the text. Equations for lines in (a) are: y = 4.26x − 113.04 for the shoal on the cooler side; y = 4.26x − 61.26 for no shoal; and y = 4.26x − 14.02 for the shoal on the warmer side. The equation for the line in (b) is y = −1.36x + 56.57. Shaded area is 95% CI around each regression line. Refer to the electronic supplementary material, table S1 for further statistical analysis.

