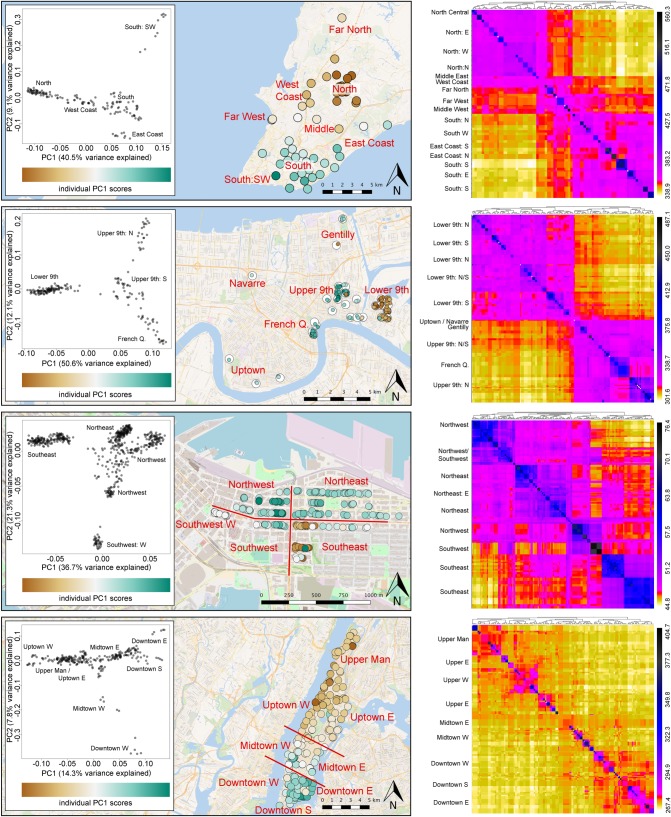
Figure 3.
Population genetic structure for brown rats in four cities as described by a PCA and coancestry heatmap generated by fineStructure. For each city from left to right we show a PCA of within-city genetic variation, then map the scores of the first PC for each individual sample. On the right is a heatmap describing shared coancestry between all samples, shown with a high-contrast scale to maximize detail for less related individuals. Heatmap labels using suffixes N, S, W, E represent cardinal directions to indicate fine-scale differences within neighbourhoods. (Online version in colour.)

