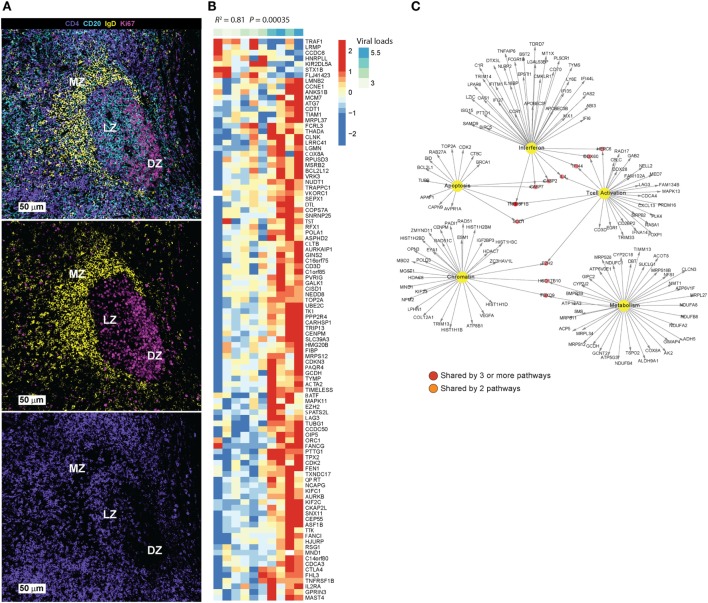
Figure 1.
(A) Main areas of a tonsillar follicle defined by IgD (yellow), CD20 (cyan), and Ki67 (magenta) are shown: marginal zone (IgDhlCD20dim), germinal center light zone (IgDnegsCD20hiKi67hi/lo) and dark zone (IgDnegPCD20dimKi67hi). The distribution of CD4 T cells (purple) is shown in the lower image. (B) Differential gene expression analysis was performed using Limma model by comparing sorted TFH cells (CXCRShigh) vs. Non-TFH (CXCR5low) from eight HIV- donors in LNs. A corrected p-value cutoff of 0.05 (BH method) was used to select significant upregulated genes (731 genes) in CXCR5high vs. CXCR5low TFH cells. Linear regression model to correlate these genes to viral load in a cohort of HIV viremic subjects (10 viremic subjects) was performed in R. Heatmap shows the log2 normalized expression of each gene transformed to z-score where the average expression of each gene was subtracted and divided by its SD across samples. Genes that correlated significantly to viral load (p-value <0.05) were shown on the heatmap. (C) Pathways enrichment analysis using genes in panel (B) and a compiled set of pathways from MsigDB C2 collection (http://software.broadinstitute.org/gsea/msigdb/collections.jsp#C2) and pathways from Chaussabel et al. (16) was performed. A FDR cutoff of 0.05 was used to selected pathways significantly correlated to viral loads. Interferon, metabolism, T cell activation and differentiation, apoptosis, and chromatin regulators were enriched. Cytoscape was used to infer gene-interacting networks of the leading genes of these pathways. Yellow nodes represent pathways name, red nodes represent genes shared by more than three pathways, orange nodes represent genes shared by two pathways, and white nodes represent genes specific to each pathway.

