
FIGURE 13.
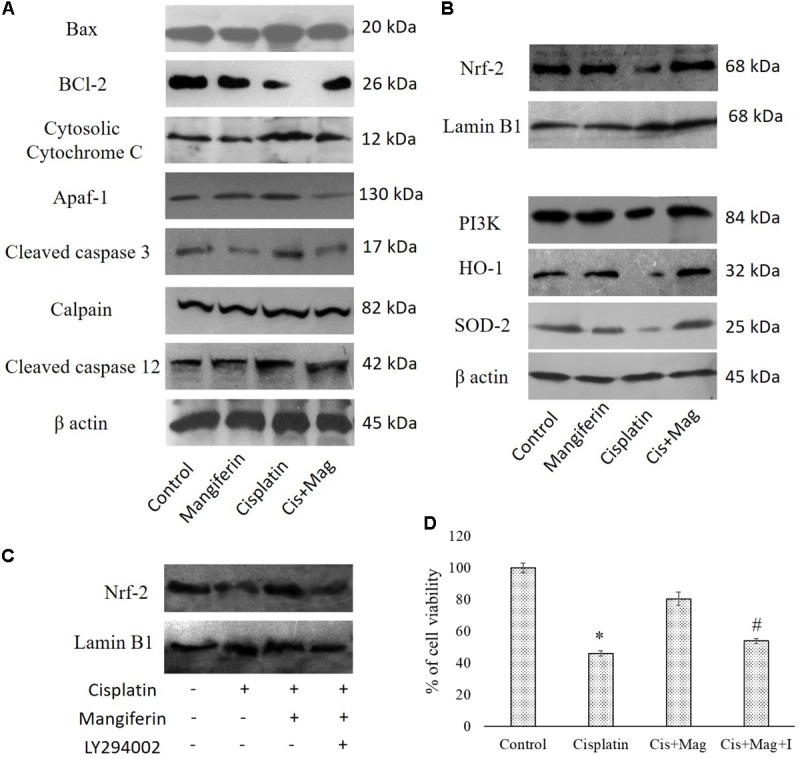
Effect of cisplatin induced renal dysfunction on stress responsive cellular proteins. (A) Effect of different stress responsive proapoptotic signaling cascades. (B) Effect of different stress responsive cell survival regulatory signaling cascades. Control: vehicle treated cells. Mangiferin: 20 mg/kg bw mangiferin treated. Cisplatin:10 mg/kg bw cisplatin treated. Cis + Mag: Treated with both mangiferin and cisplatin. (C) Immunoblot analysis of Nrf-2 on LY294002 and mangiferin pretreated cisplatin exposed NKE cells. LaminB1 was used as a loading control. (D) MTT cell viability assay to investigate the effect of PI3K inhibition on the cytotoxic effect of cisplatin on NKE cells. Control: untreated cells; Cisplatin: cells were exposed to 25 μM cisplatin; Cis + Mag: cells were exposed to 25 μM cisplatin and pre-treated with 20 μM mangiferin. Cis+ Mag+ I: cells were exposed to 25 μM cisplatin and pre-treated with 10 μM LY2492002. Each column represents mean ± SD, n = 3. “∗” Represents the significant difference with the control cells (∗P < 0.05). “#” Represents significant difference with the mangiferin pretreated cisplatin exposed cells (#P < 0.05).