
FIGURE 1.
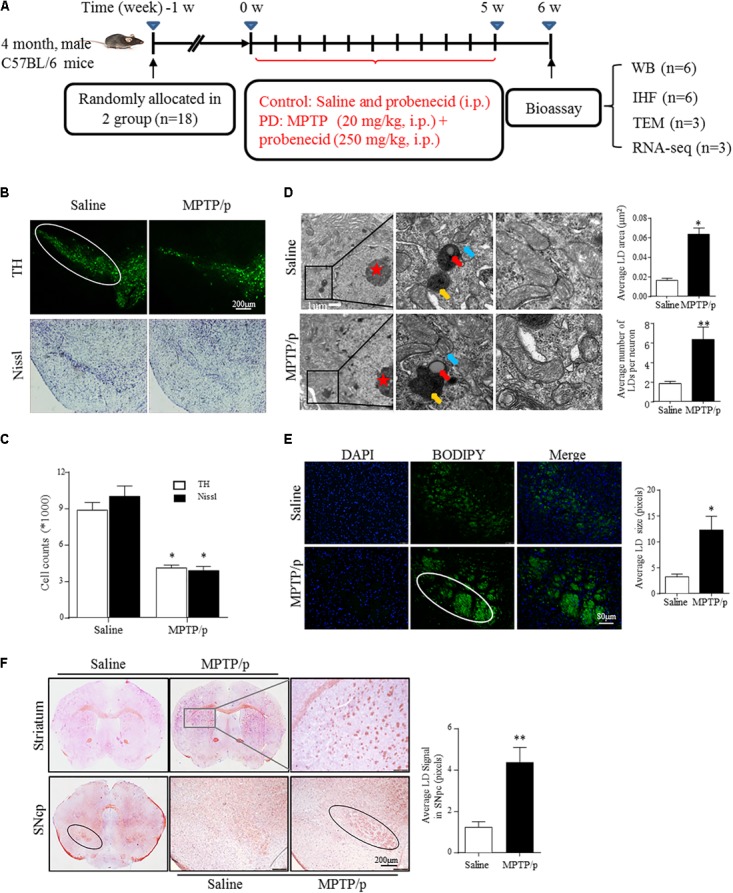
Lipid droplets (LDs) accumulate in the mesencephalon of MPTP/p-treated mice. (A): Diagram of the experimental design. Four-month-old male C57BL/6 mice were grouped and treated as indicated. Mice were transcardially perfused at the endpoint for bioassay. (B,C) A: TH and Nissl staining of the mouse brain sections. In a saline-injected control, there is a dense TH+ and Nissl+ network of cell bodies in the SNpc. After MPTP injection, there is a dramatic reduction in TH immunoreactivity and Nissl staining. Scale bar: 200 μm. B: Stereology of the loss of SNpc neurons in NC and MPTP-dosed mice. ∗P < 0.05 vs. saline group, determined by one-way ANOVA (n = 6). (D) TEM of mesencephalon tissues comparing LD accumulation in neurons (with red stars indicating the nucleus) and distribution relative to organelles, as indicated. Middle frames with red arrows show lipid containing vesicles, yellow shows the autolysosome and blue shows mitochondria. Right frames displayed normal (up) and abnormal (down) mitochondria. (E,F) Tissues from (B) stained with BODIPY (E) and Oil Red O (F). BODIPY showed more LD accumulation in SNpc (outlined in white) of PD model mice, in contrast to controls. (F) Whole-mount brain sections show LD accumulation in the SNpc (outlined in black), and abnormal intensely stained cross-sections of TH+ axon morphology can be seen in the striatum (frame shows higher magnification) of PD model mice, in contrast to the controls. Scale bar as indicated. Data shown in (D–F): quantitation of LD number and size. ∗P < 0.05, ∗∗P < 0.01 vs. saline group as determined by Student’s t-test (n = 4).