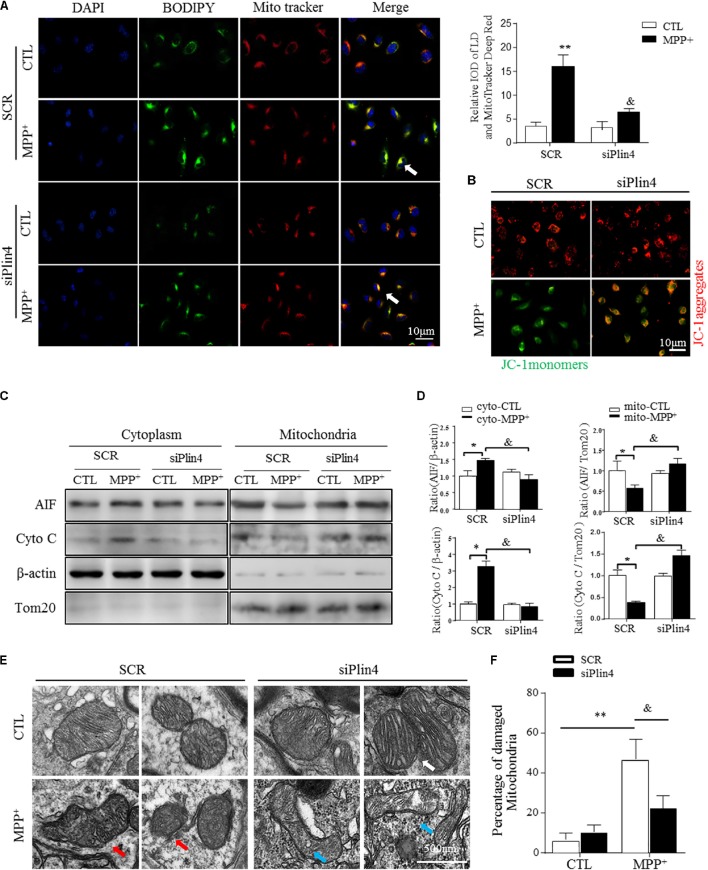
FIGURE 4.
Knockdown of Plin4 reverses mitochondrial damage in MPP+ cell model. (A) Intracellular distribution of LDs (BODIPY493/503) and mitochondria (MitoTracker Deep Red) in MPP+-stimulated SH-SY5Y cells were examined by fluorescence microscopy. Arrows indicate cells with colocalization of LDs and mitochondria; the integrated optical density (IOD) of BODIPY493/503 and MitoTracker Deep Red immunofluorescence is presented on the right. (B) MPP+-induced mitochondrial membrane potential changes in WT (SCR) or Plin4-deficient (siPlin4) SH-SY5Y cells were measured by JC-1 staining. Scale bar: 10 μm. (C) SH-SY5Y cells described in (B) were harvested, and then, mitochondria and cytosol were separated using a commercial kit and assessed for AIF and Cyto C expression. (D) Quantification of protein expression in (C). β-actin and Tom20 were utilized as endogenous control genes for cytosol and mitochondria, respectively, and relative expression levels were determined by normalizing to those in the SCR-CTL samples. (E) Electron micrographs of mitochondria in WT (SCR) or Plin4-deficient (siPlin4) SH-SY5Y cells incubated with MPP+ as described above. Shown are representative examples of normal (white arrow), partially damaged (blue arrow), and heavily damaged mitochondria (red arrow). Scale bar: 500 nm. (F) Quantification of damaged mitochondria in (E). Data in (A,D,F) are shown as mean ± SEM. ∗P < 0.05, ∗∗P < 0.01 vs. SCR-CTL, &P < 0.05 vs. SCR-MPP+ as determined by two-way ANOVA.

