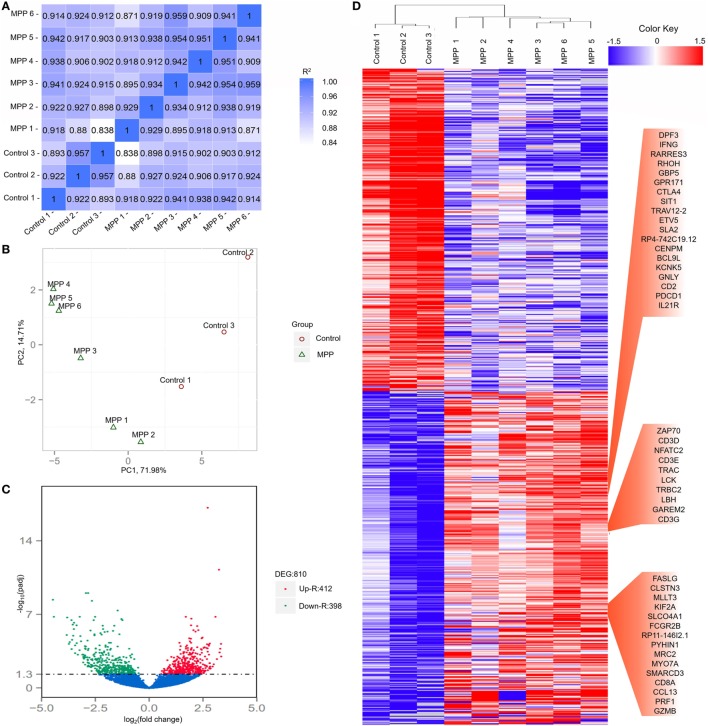
Figure 2.
Evaluation of each bronchoalveolar lavage fluid sample included in this study and differentially expressed genes between Mycoplasma pneumoniae pneumonia (MPP) group and control group. (A) The correlation coefficient heat map of MPP group and control group. Correlation matrix shows a high consistency of measurements within each group, R2 ≥ 0.8 is needed for the up-coming analyzing. (B) Principal component analysis (PCA) plot of the sequencing samples. PCA is conducted to evaluate the clustering nature of the samples. The repeatability of the samples has been shown. Each point represents one sample, the red circles represent the samples in the MPP group, and the green triangles represent the samples in the control group. Percentages are contribution ratios. (C) Volcano plot of genes differentially expressed between MPP group and control group. Each point represents one gene that is detectable in both groups. The red points represent the significantly upregulated (Up-R) genes; the green points represent the significantly downregulated (Down-R) genes. (D) Cluster of 810 genes showing significantly regulated genes between MPP group and control group. All of the genes that are differentially expressed between MPP group and control group by adjusted p value < 0.05 have been selected.

