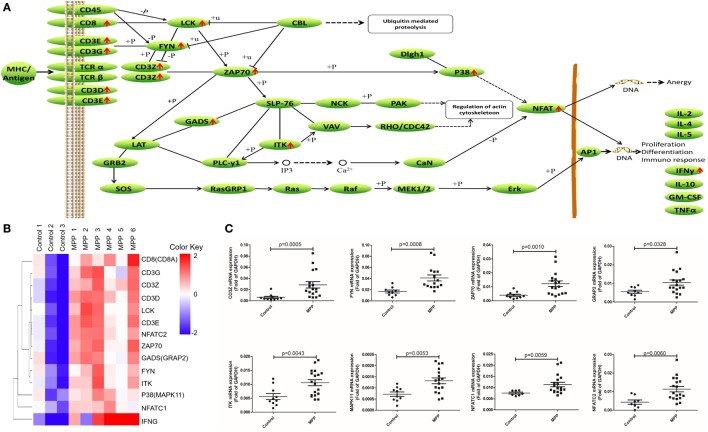
Figure 6.
Differential expression genes (DEGs) mapped to T cell receptor signaling pathway Kyoto encyclopedia of genes and genomes pathway. (A) Model diagram showing T cell receptor signaling pathway, red arrows indicate upregulated gene expression. (B) Cluster analysis of DEGs that mapped to T cell receptor signaling pathway. (C) Quantitative real-time PCR validation of DEGs mapped to T cell receptor signaling pathway.

