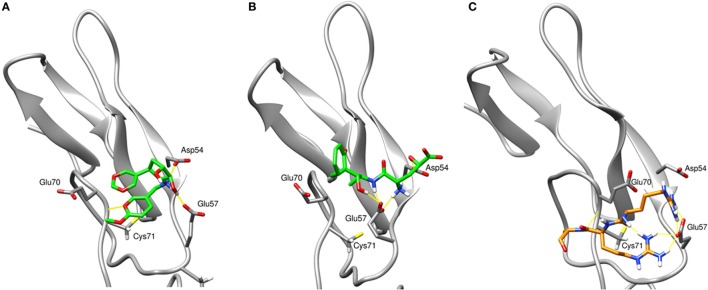
Figure 1.
The final snapshots of 15-ns molecular dynamics (MD) simulations of the TNF receptor type II (TNFR2)–ligand complexes: (A) compound ZINC72321887 and (B) compound ZINC67911837 at region 3 of TNFR2. (C) The binding pattern of TNF–TNFR2 at the 20-ns MD snapshot. Only contacting residues, such as Arg31, Arg32, and Ala33, of TNF are displayed. The TNFR2 protein is drawn with cartoon style in gray and the ligand or TNF with sticks in green or orange. Hydrogen bonds are indicated with yellow lines.

