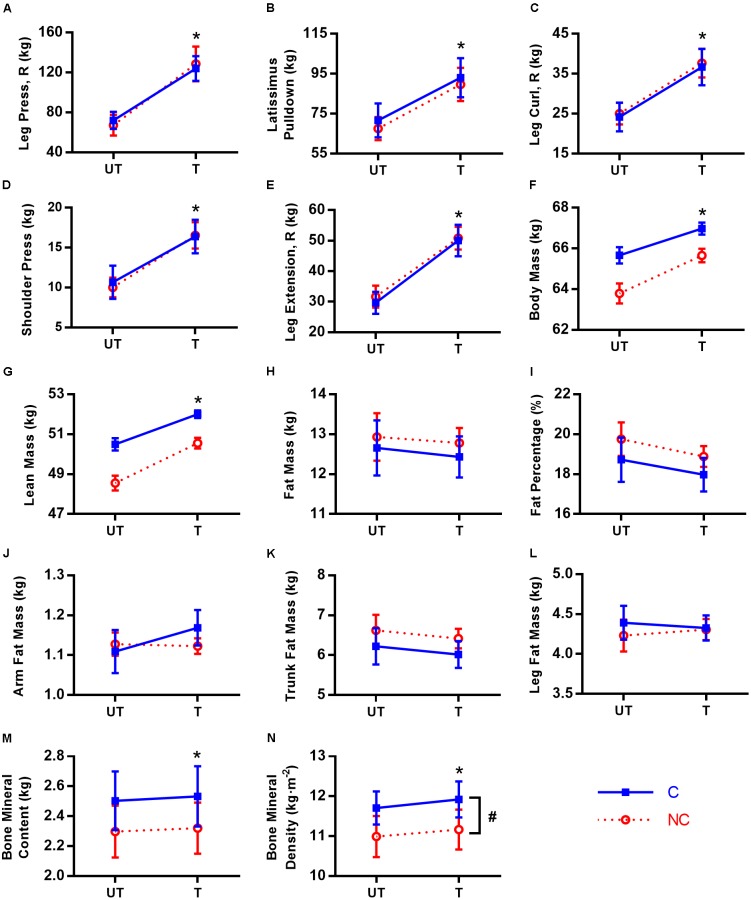
FIGURE 2.
Ten-repetition maximum and body composition in untrained (UT) and trained (T) states for consecutive (C,  ) and non-consecutive (NC,
  ) groups for: leg press with right leg (A), latissimus pulldown (B), leg curl with right leg (C), shoulder press (D), leg extension with right leg (E), body mass (F), lean mass (G), fat mass (H), fat percentage (I), arm fat mass (J), trunk fat mass (K), leg fat mass (L), bone mineral content (M), and bone mineral density (N). Values are means with 95% confidence interval. For (F–L), means are calculated from predicted values after adjustment for covariates. No significant training × group interaction for all parameters (p = 0.075–0.974). ∗Significant difference between UT and T states (p < 0.001). #Significant group difference between C and NC (p = 0.025).

