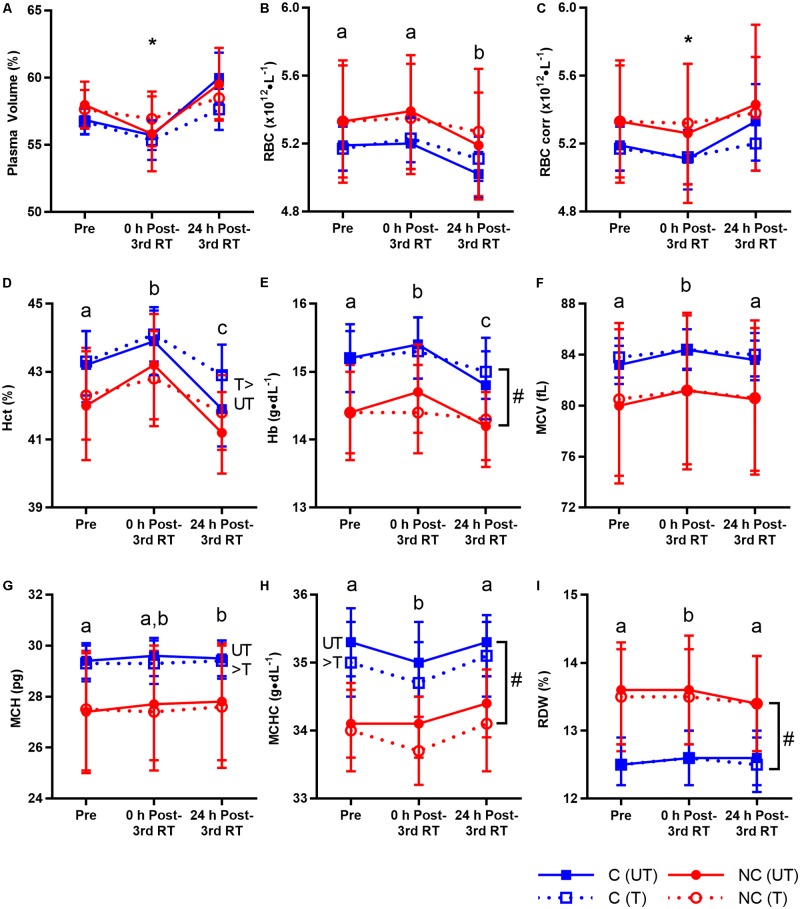
FIGURE 3.
Plasma volume and red blood cell (RBC) parameters before resistance training (RT) at first session (Pre), and 0 and 24 h post-3rd RT session in untrained (UT, solid lines) and trained (T, dotted lines) states for consecutive (C, blue squares) and non-consecutive (NC, red circles) groups: plasma volume (A), RBC count (B), RBC count corrected for plasma volume changes (C), hematocrit (D), hemoglobin (E), mean corpuscular volume (F), mean corpuscular hemoglobin (G), mean corpuscular hemoglobin concentration (H), and RBC distribution width (I). Values are means with 95% confidence interval. No significant interaction for all parameters (p= 0.076–0.994) except corrected RBC count (∗significant time × training interaction, p = 0.001; details in text). Significant main effect of time for all parameters (p < 0.001–0.003). Different letters indicate significant difference from other time points (p < 0.001–0.040). Comparison between UT and T states indicates significant difference between them (p = 0.001–0.041). #Significant group difference between C and NC (p = 0.006–0.030).

