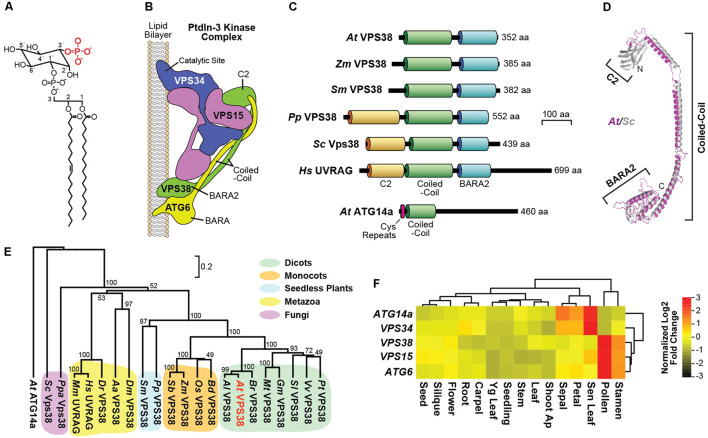
FIGURE 1.
Description of the Arabidopsis class-III PtdIn-3 kinase complex and architecture and expression of the VPS38 subunit. (A) Chemical structure of a representative PtdIn-3P. The 3′ phosphate group is highlighted in red. (B) Subunit organization of the yeast class-III PtdIns-3 kinase complex II based on a crystallographic structure [PDB entry 5DFZ (Rostislavleva et al., 2015)]. The VPS34, VPS15, ATG6 (VPS30/Beclin1), and VPS38 subunits are labeled along with relevant domains. (C) Architecture and domain organization of members in the VPS38 family. The lipid-binding C2, coiled-coil, and BARA2 domains are highlighted. The amino acid (aa) length of each protein is indicated. Arabidopsis ATG14a, with its pair of cysteine repeats, is included for reference. (D) The predicted 3D model for Arabidopsis VPS38 (magenta) based on the yeast Vps38 structure (gray). The Arabidopsis sequence was threaded into the yeast structure (Rostislavleva et al., 2015) using SWISS-MODEL, and the ribbon diagrams were superimposed. N, amino-terminus; C, carboxy-terminus. (E) Phylogenetic tree of the VPS38/UVRAG family. The phylogenetic relationships based on protein sequences were assessed by MEGA 7, using the unweighted pair group method with arithmetic mean, and visualized with TreeView. Arabidopsis VPS38 is highlighted in red. The scale bar indicates the percent distance. ClustalX alignment of the VPS38 sequences based on identity/similarity is shown in Supplementary Figure S1. Species abbreviations are: Aa, Aedes aegypti; Al, Arabidopsis lyrata; At, Arabidopsis thaliana; Bd, Brachypodium distachyon; Br, Brassica rapa; Dm, Drosophila melanogaster; Dr, Danio rerio; Gm, Glycine max; Hs, Homo sapiens; Mt, Medicago truncatula; Os, Oryza sativa; Pp, Physcomitrella patens; Ppa: Pichia pastoris; Pt, Populus trichocarpa; Sb, Sorghum bicolor; Sc, Saccharomyces cerevisiae; Sl, Solanum lycopersicum; Sm, Selaginella moellendorffii; Vv, Vitis vinifera; and Zm, Zea mays. (F) Expression heat map of transcripts encoding subunits of the Arabidopsis class-III PtdIn-3 kinase complex. The mRNA abundances were obtained from GENEVESTIGATOR (https://www.genevestigator.com) and clustered by tissue distributions and expression patterns. The relative expression of each gene presented in Z-score was normalized against the mean value by Log2 transformation. Values for the ATG14a mRNA were included as a reference.

