FIGURE 8.
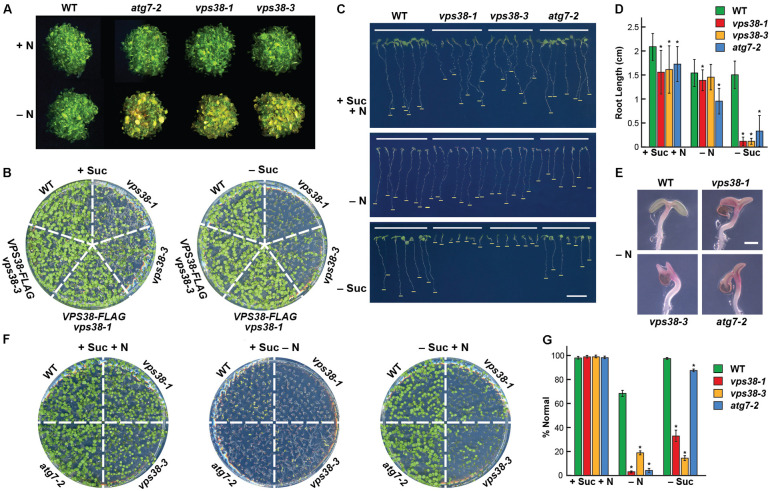
vps38 mutants have increased sensitivity to nitrogen and fixed-carbon starvation. (A) Enhanced sensitivity to nitrogen starvation. WT, vps38-1, and vps38-3 plants were grown on nitrogen-containing liquid MS medium for 1 week and then transferred to either nitrogen-rich (+N) or nitrogen-deficient (–N) liquid medium for 1 week. WT and autophagy-defective atg7-2 seedlings were included as negative and positive controls, respectively. (B) Enhanced sensitivity to fixed-carbon starvation. WT, vps38-1, vps38-3, and the VPS38 complementation seedlings were grown on either sucrose-containing (+Suc) or sucrose-deficient (–Suc) solid MS medium under a LD photoperiod for 2 weeks. (C) vps38 roots are hypersensitive to fixed-carbon starvation relative to atg7-2 roots. Seedlings were grown vertically for 10 days on solid MS medium with or without nitrogen (–N) and sucrose (–Suc). Bars indicate the extent of root growth. (D) Quantitation of the effects of fixed-carbon and nitrogen starvation on root growth as shown in (C). Each bar represents the average of 37–60 seedlings (±SD). Asterisks indicate significant differences by the Student’s t-test (p-value < 0.01). (E) Close-up views of cotyledons showing the enhanced anthocyanin accumulation in vps38 and atg7-2 seedlings under nitrogen starvation. Scale bar = 0.5 mm. (F) vps38 shoots are hypersensitive to fixed-carbon starvation relative to the autophagy mutant atg7-2. Seedlings were grown horizontally for 10 days on solid MS medium with or without nitrogen (–N) and sucrose (–Suc). (G) Quantitation of the effects of fixed-carbon and nitrogen starvation based on the survival of seedlings shown in (F). Percent normal assessed whether the plants did not accumulate high levels of anthocyanins when grown without nitrogen, or did not displayed severely stunted development when grown with or without sucrose, as compared to WT plants grown in replete medium. Each bar represents the average of 37–60 seedlings (±SD). Asterisks indicate significant differences by the Student’s t-test (p-value < 0.01).

