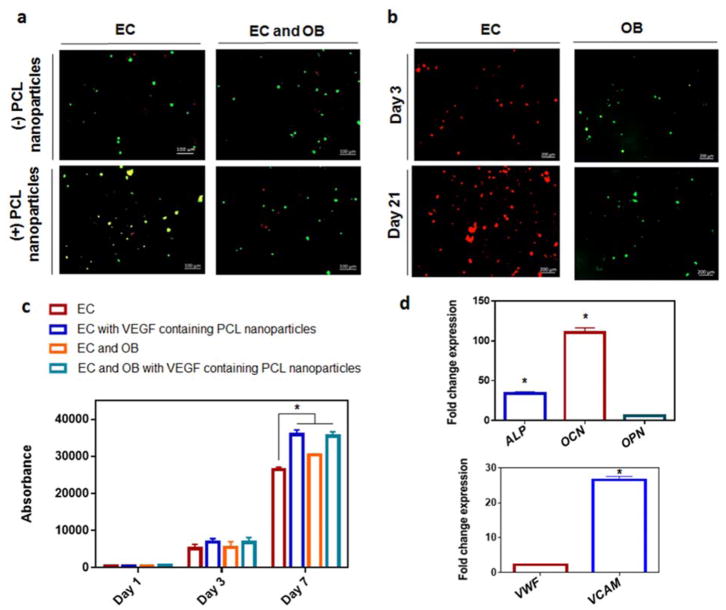
Fig. 5.
Growth and activity of osteogenic cells and vasculogenic cells co-cultured in injected STH material a) Live/dead fluorescent imaging at day 7 of mouse endothelial cells (EC) in monoculture, or co-culture with mouse osteoblasts (EC and OB) with/without the addition of PCL nanoparticles showing live cells in green and dead cells in red. Scale bars represent 100 μm. b) Live cell tracker of EC in red and OB in green cultured for up to 21 days in shear thinning gels with the addition of PCL nanoparticles. Scale bars represent 200 μm. c) Presto blue measurements of monoculture of EC or co-culture with OB, with/without the addition of VEGF-containing PCL nanoparticles to the STH. d) Gene expression within STH with VEGF-containing PCL nanoparticles. Fold change gene expression of co-cultures of BMSCs with HUVECs cells in, relative to monoculture of either BMSCs (for osteogenic genes) or HUVECs (for angiogenic genes). * indicates statistical differences between indicated groups (p<0.05)

