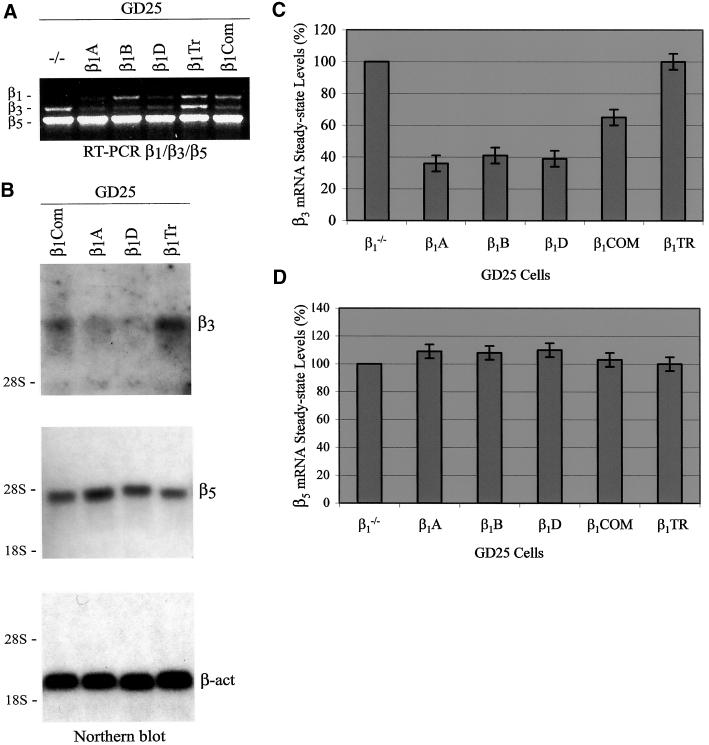
Figure 5.
Comparative analysis of β3 and β5 mRNA steady-state levels in GD25 cells expressing different integrin β1 forms. Total RNA was isolated from 1 × 10⁷ cultured cells as described in MATERIALS AND METHODS. (A) Multiplex RT-PCR assay for the simultaneous detection of β1, β3, and β5 mRNAs in GD25 cells expressing either the β1A, β1B, or β1D isoforms or two β1 deletion mutants lacking the entire cytoplasmic domain (β1TR) or the cytoplasmic domain variable region (β1COM). (B) Northern blot: equal amounts of total RNA (25 μg/lane) were probed sequentially by 32P-labeled mouse integrin β3 and β5 cDNA fragments and by a 32P-labeled β-actin probe as a control for RNA loading. The positions of 28s and 18s rRNAs are indicated as markers for RNA sizes. (C and D) Scanning densitometry analysis of β3 and β5 mRNA levels as detected by Northern blot. Northern signals were normalized to β-actin and displayed as percentage of the control (GD25). Data are representative of three independent experiments. Notice that the down-regulation of β3 mRNA steady-state level occurs irrespective of the type of the β1 isoform and is dependent on the presence of the β1 cytoplasmic domain common region.

