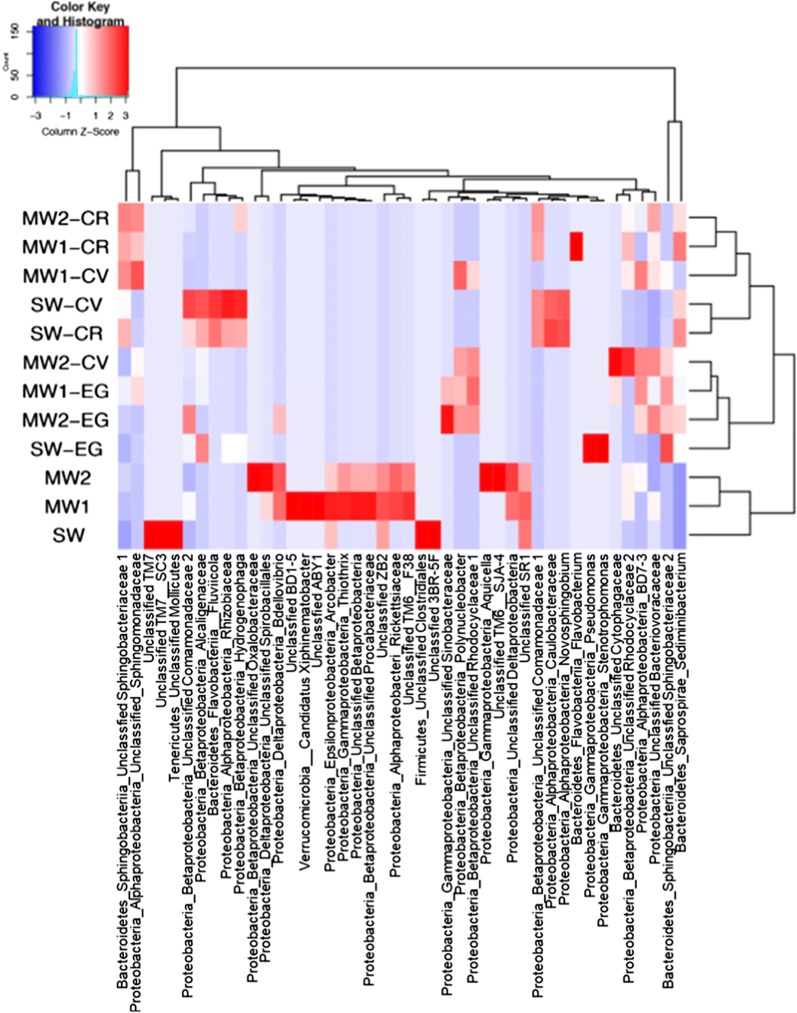
Fig. 6.
Heatmap showing the most abundant family or genera in all samples. Heatmap was constructed from the Bray–Curtis dissimilarity matrix using genera (> 1% relative abundance). Cluster dendrograms are based on average linkage hierarchical clustering. MW1 municipal wastewater effluent 1, MW2 municipal wastewater effluent 2, SW swine wastewater effluent, CR Chlamydomonas reinhardtii, CV Chlorella vulgaris, EG Euglena gracilis

