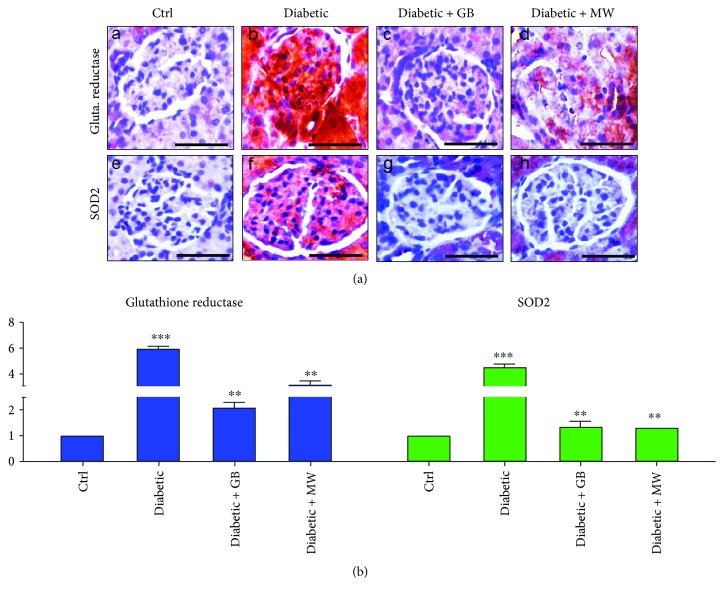
Figure 5.
GB- and MW-protective effect against oxidative stress induced by type 2 diabetes. ((a), A–D) Paraffin sections stained with antiglutathione reductase antibody. The expression of glutathione reductase was increased in dabetic glomeruli and back to almost normal after the use of GB and MW. Furthermore, ((a), E–H) paraffin tissue sections stained with anti-SOD2 antibody. SOD2 expression was intensively increased in diabetic glomeruli with the use of GB and MW comparable with the control. Scale bar: 50 μm. ImageJ analysis displayed a significant increase in glutathione reductase and SOD2 intensities in diabetic glomeruli compared to Ctrl. In Diabetic+GB and Diabetic+MW glomeruli, glutathione reductase and SOD2 protein expression intensities were decreased to be comparable with Ctrl (b).

