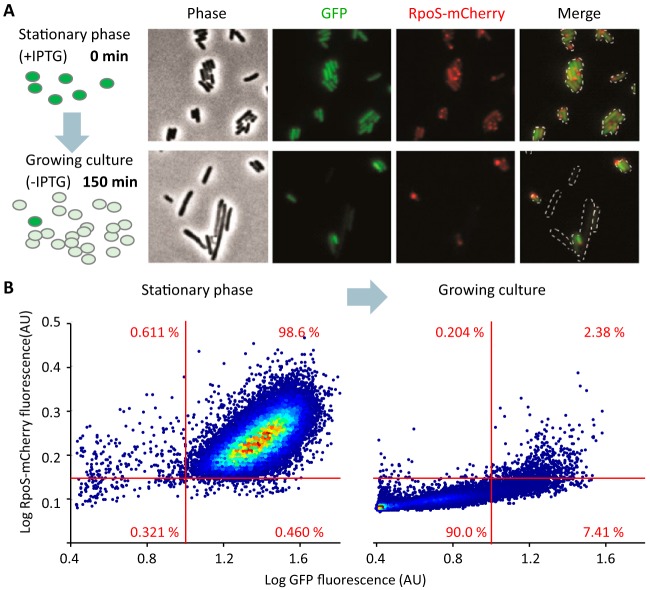
FIG 2 .
RpoS-mCherry reports nongrowing cells in exponentially growing cultures. (A) Illustration of the GFP dilution system used (57). E. coli MG1655 rpoS-mcherry cells transformed with pETgfpmut2 were grown to stationary phase with IPTG to induce gfp expression, washed, diluted in fresh LB medium without IPTG, and grown for 150 min. GFP will be diluted in dividing cells while it will be retained in nongrowing cells. Fluorescence microscopy images of both stationary-phase and exponential-phase cells are shown. (B) Fluorescence microscopy population analysis of cells prepared as in panel A. A total of 35,185 (stationary phase; left) and 29,469 (exponential phase; right) cells from two independent replicates were identified by CellProfiler. Log median red and green fluorescence values for each cell were measured and plotted. Fluorescence is shown in arbitrary units (AU). The percentage of cells in each quadrant is indicated.

