
FIG 3 .
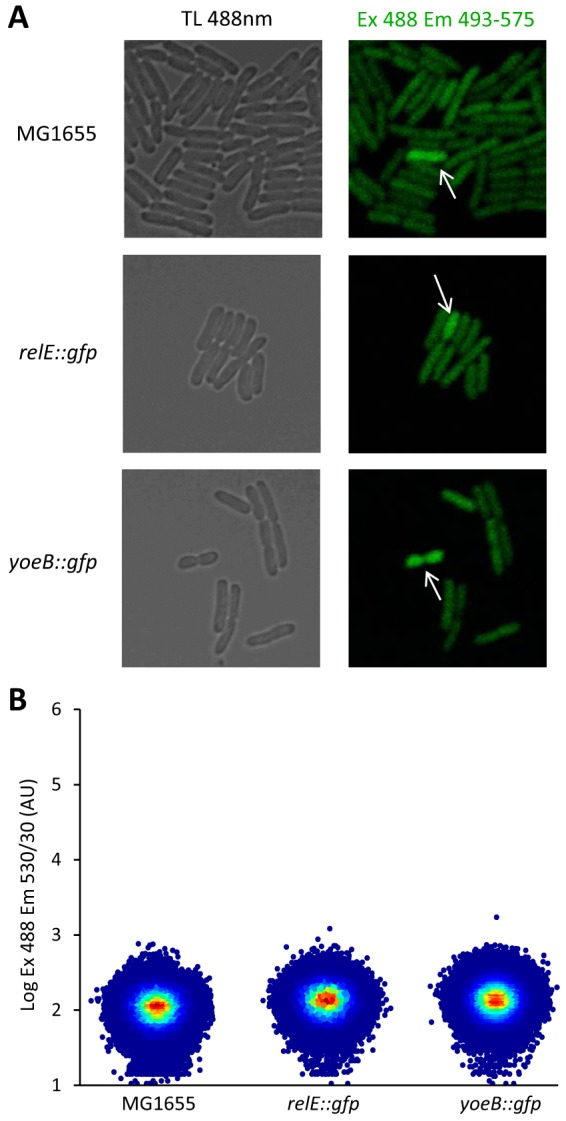
Fluorescence analysis of TA::gfp reporters. (A) Confocal microscopy of E. coli MG1655 and its derivatives containing yoeB::gfp and relE::gfp grown to exponential phase. The white arrows show cells with above-average fluorescence levels. TL, transmitted light; Ex, excitation; Em, emission. (B) Flow cytometry analysis of strain MG1655 in comparison with the yoeB::gfp and relE::gfp reporter strains grown to exponential phase. Analyses were performed on 1,000,000 events. Three independent biological experiments were performed, and a representative example is displayed for each strain.