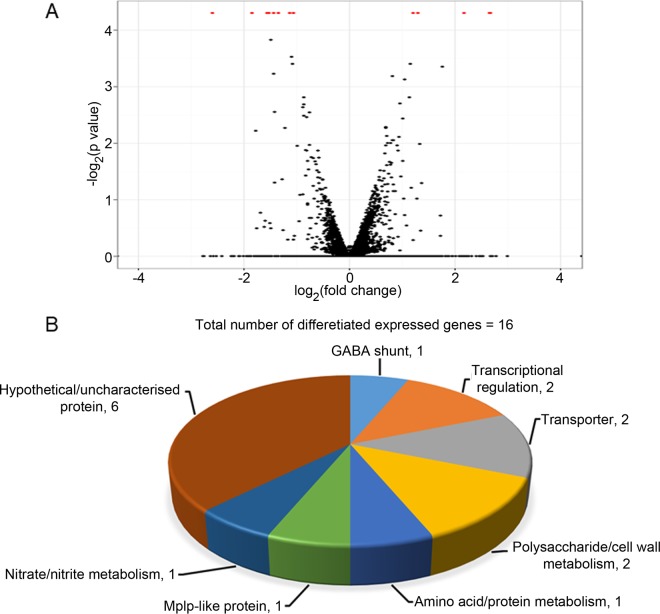
FIG 5 .
(A) Volcano plot of the RNA-seq data. (B) Classification of differentially expressed genes in TmPV1-infected T. marneffei isolate PM1 compared to isogenic TmPV1-free isolate. A total 16 genes were differentially expressed as indicated by red dots in the volcano plot, among which 11 genes were upregulated and 5 genes were downregulated. Classification of genes was based on the gene ontology terms as determined by UniProt and manual annotation. The number of genes is denoted next to each category designation.

