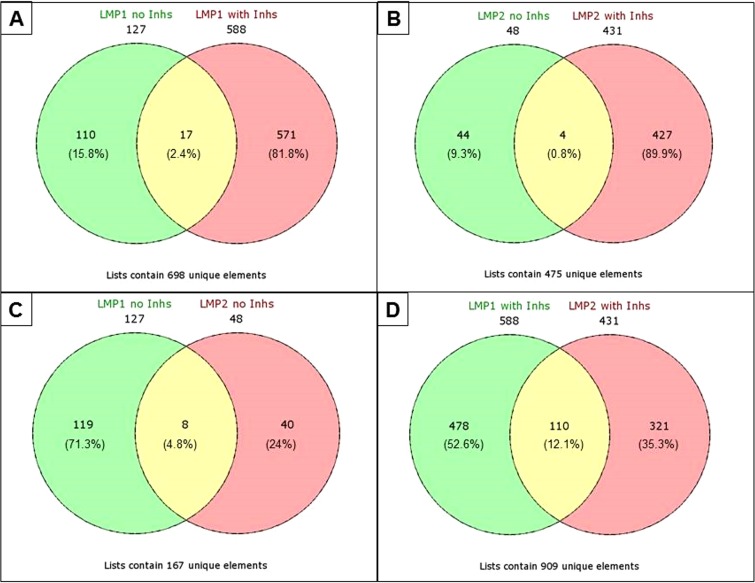
FIG 2 .
Venn diagrams displaying the overlap in the number of significantly different proteins between treatment groups. (A) LMP1-noInhs compared to LMP1+Inhs; (B) LMP2A-noInhs compared to LMP2A+Inhs; (C) LMP1-noInhs compared to LMP2A-noInhs; (D) LMP1+Inhs compared to LMP2A+Inhs. Proteins common to both groups are listed in Table 2.

