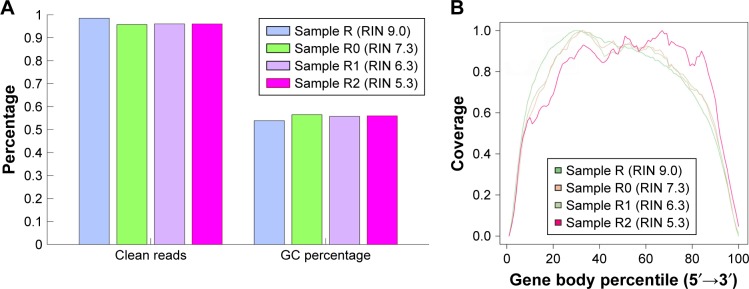
Figure 2.
Number of clean reads, GC percentage and gene body coverage of the samples with different RIN values.
Notes: (A) The number of clean reads and GC percentage of the samples with different RIN values. Percentage of clean reads: Sample R (RIN 9.0) was 98.5%; Sample R0 (RIN 7.3) was 96.0%; Sample R1 (RIN 6.3) was 96.0% (average percentage of clean reads of Sample R1-1 and R1-2); Sample R2 (RIN 5.3) was 96.0% (average percentage of clean reads of Sample R2-1 and R2-2); GC percentage: Sample R (RIN 9.0) was 53.9%; Sample R0 (RIN 7.3) was 56.5%; Sample R1 (RIN 6.3) was 55.8% (average GC percentage of Sample R1-1 and R1-2); Sample R2 (RIN 5.3) was 56.0% (average GC percentage of Sample R2-1 and R2-2). (B) Gene body coverage of samples with different RIN values. “R” represents the samples that were used to extract RNA immediately, and then the RNAs were stored at room temperature (25°C) for different times (30 min–24 h).
Abbreviation: RIN, RNA integrity number.

