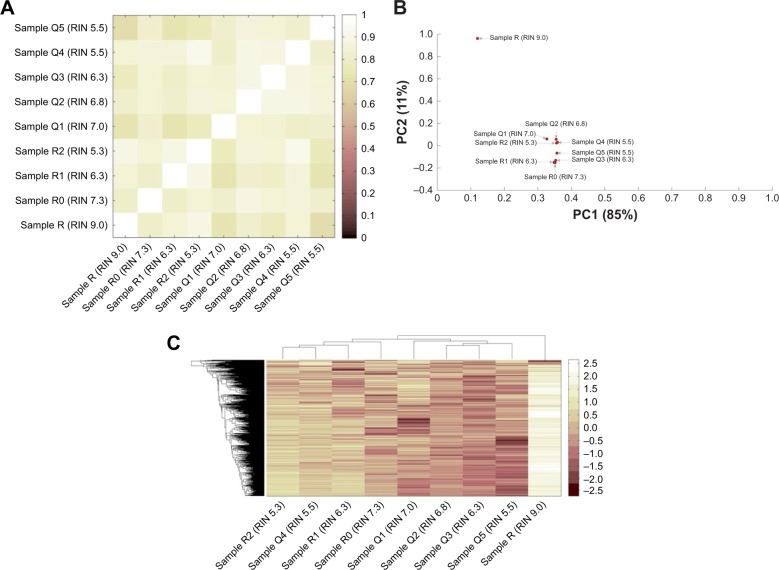
Figure 4.
Impact of RNA integrity and blood sample storage conditions on the gene expression profiles.
Notes: Sample R, Sample R0, Sample R1 and Sample R2 were the RNA samples that were extracted immediately after blood collection and then stored at room temperature (25°C) for different time periods. Sample Q1, Sample Q2, Sample Q3, Sample Q4 and Sample Q5 were the RNA samples extracted from the blood samples that were stored at 4°C for 4 hours, 1 day, 3 days, 5 days and 7 days. (A) Correlation matrix based on the Gene Expression Data; (B) Loading Factors Plot of PCA: 2-dimensional PCA plot of genome-wide expression profiles showing PC1 and PC2. The first axis (PC1) accounts for 85% of the overall variance of the data, the second axis accounts for 11% (PC2). At the PC1, the loading coefficients were 0.12 for Sample R (RIN 9.0), 0.35 for Sample R0 (RIN 7.3), 0.35 for Sample R1 (RIN 6.3), 0.36 for Sample R2 (RIN 6.3), 0.33 for Sample Q1 (RIN 7.0), 0.35 for Sample Q2 (RIN 6.8), 0.35 for Sample Q3 (RIN 6.3), 0.36 for Sample Q4 (RIN 5.5) and 0.36 for Sample Q5 (RIN 5.5). (C) Heatmap of cluster analysis. “R” represents the samples that were used to extract RNA immediately, and then the RNAs were stored at room temperature (25°C) for different times (30 min–24 h). “Q” represents the samples that were stored at 4°C for 4 hours, 1 day, 3 days, 5 days and 7 days prior to RNA extraction, respectively.
Abbreviations: PCA, principal components analysis; PC1, principal components 1; PC2, principal components 2; RIN, RNA integrity number.

