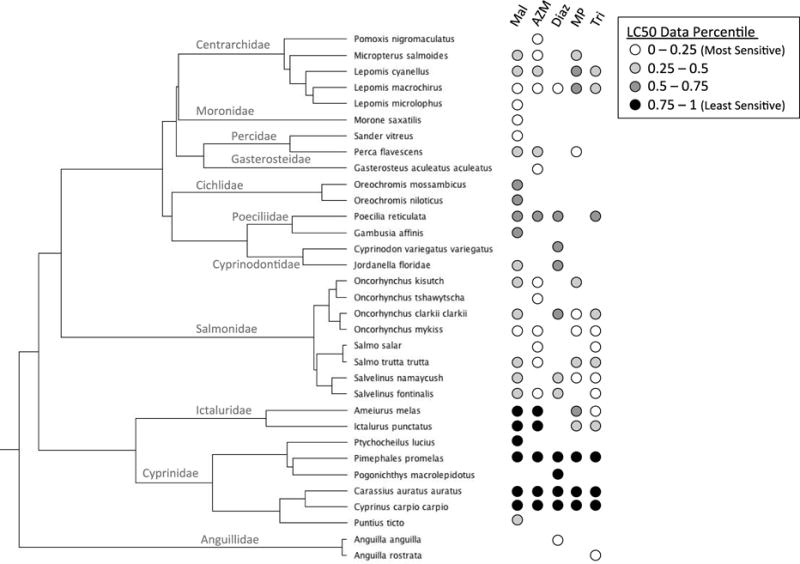
Figure 2.

Phylogeny of fish with toxicity data overlaid from five organophosphates (malathion (Mal), azinphos-methyl (AZM), diazinon (Diaz), methyl parathion (MP), and trichlorfon (Tri)) with strong phylogenetic signal (i.e., λ > 0.5 and significantly different from 0). Toxicity data percentiles represent scaling of the LC50 for each species-chemical pair as a proportion between the lowest and highest log-LC50 value across all species for a given chemical. Fish family names are included in the tree next to corresponding taxon branches.
