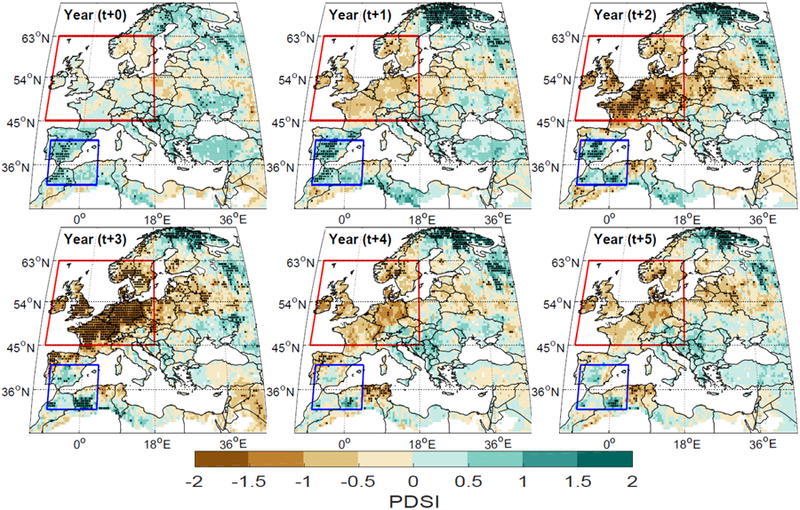
Figure 2.

Superposed epoch analysis (SEA) showing OWDA JJA PDSI response to volcanic forcing for years t+0 through t+5 between 1100–2012 C.E. Response is the median value for each grid cell. Stipples indicate statistically significant (p<0.05, one-tailed) epochal anomalies.
