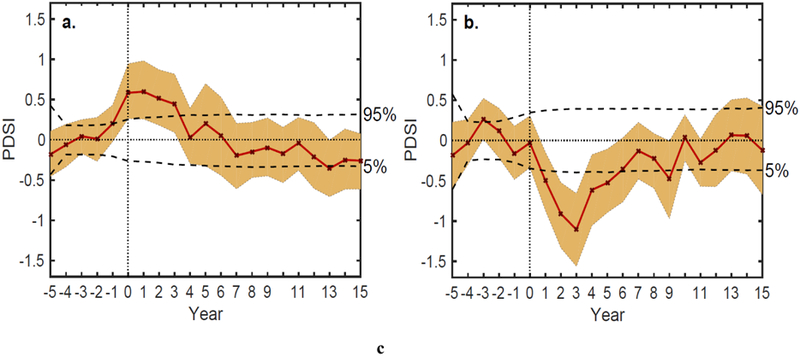
Figure 3.

SEA showing area-weighted mean PDSI response over (a.) western Mediterranean (blue box - Figure 2) and (b.) northwestern Europe (red box - Figure 2). Uncertainty intervals are 10th and 90th percentile of the response. Dashed horizontal line indicates threshold required for statistically significant (p<0.05, one-tailed) epochal anomalies.
