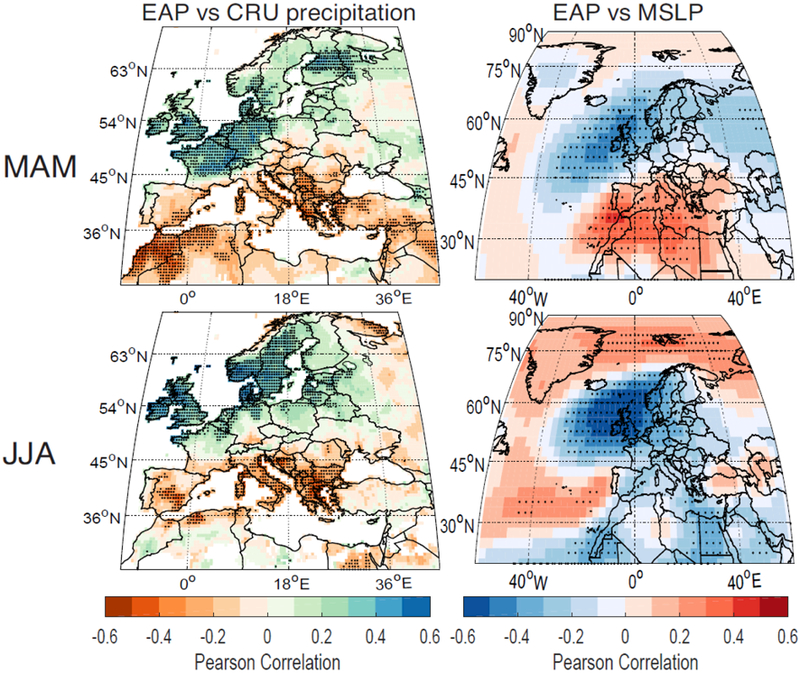
Figure 4.

Correlation between East Atlantic Pattern (EAP) and (left) CRU precipitation (right) NCAR-NCEP mean sea level pressure (MSLP) for (upper panel) MAM, and (lower panel) JJA between 1950 and 2012. Stippling indicates significant correlation (p<0.05, 2-sided, Student’s t-test). Note different colorbars.
