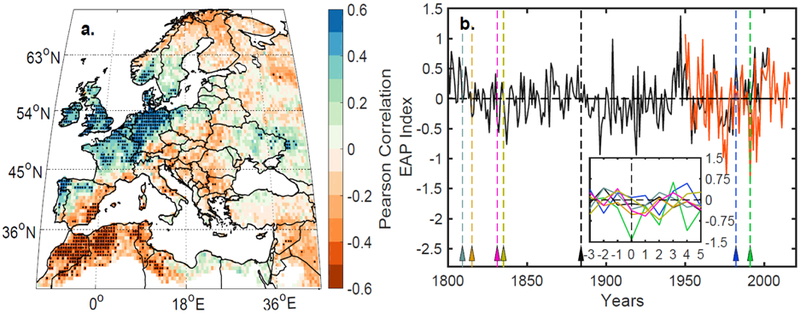
Figure 5.

EAP and European hydroclimate. (a.) Correlation between April-July (AMJJ) NOAA-CPC EAP index and OWDA JJA PDSI between 1950–1978. Stippled blue (red) shading indicates significant positive (negative) correlation (p<0.05, 2-sided Student’ t-test). (b.) AMJJ NOAA-CPC EAP index between 1950–2016 (red) and estimated from Casty et al. [2007] 500 hPa reconstruction (black - see Text S2). Inset shows five-year post-eruptive AMJJ EAP response after 1809 (grey), 1815 (yellow), 1831 (pink), 1835 (olive), 1884 (black), 1982 (blue), and 1991 (green) after subtracting five-year pre-event mean.
