
Figure 4.
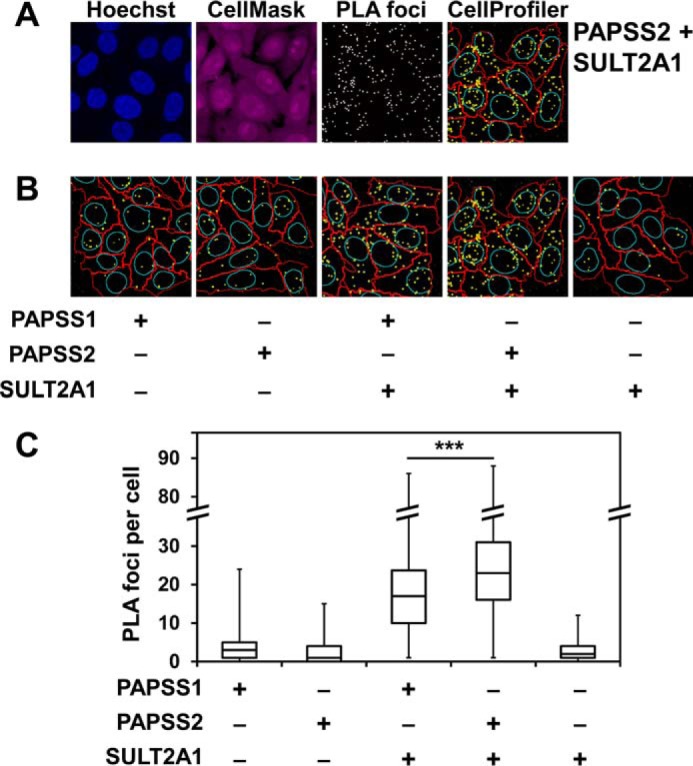
A physical interaction of PAPSS2 and SULT2A1 detected by proximity ligation assays. A, representative images of the proximity ligation assay between PAPSS2 and SULT2A1 as well as subsequent analysis with CellProfiler. Endogenous PAPS synthases and SULT2A1 were detected by mouse monoclonal antibodies for PAPSS1 or PAPSS2 and a rabbit SULT2A1 polyclonal antibody in a HepG2 cell line. PLA analysis, including automated cell and nucleus recognition and foci counting was carried out using CellProfiler software. Cell nuclei were stained with Hoechst 33342 (blue); CellMask staining is shown in magenta. PLA foci are shown in white in the single channel picture. In the output image of CellProfiler analysis edges of nuclei are represented in cyan, cell boarders in red, and PLA foci in yellow. B, CellProfiler results for all other combinations. Negative controls were generated using only one primary antibody at a time. ×600 magnification for A and B. C, box-and-whisker analysis of the PLA foci number per cell from at least 400 cells pooled from three independent experiments. Data were found to be not normally distributed; hence, one-way ANOVA (p value < 0.001) and post hoc Bonferroni tests (***, p < 0.001) were performed after data were square root transformed.