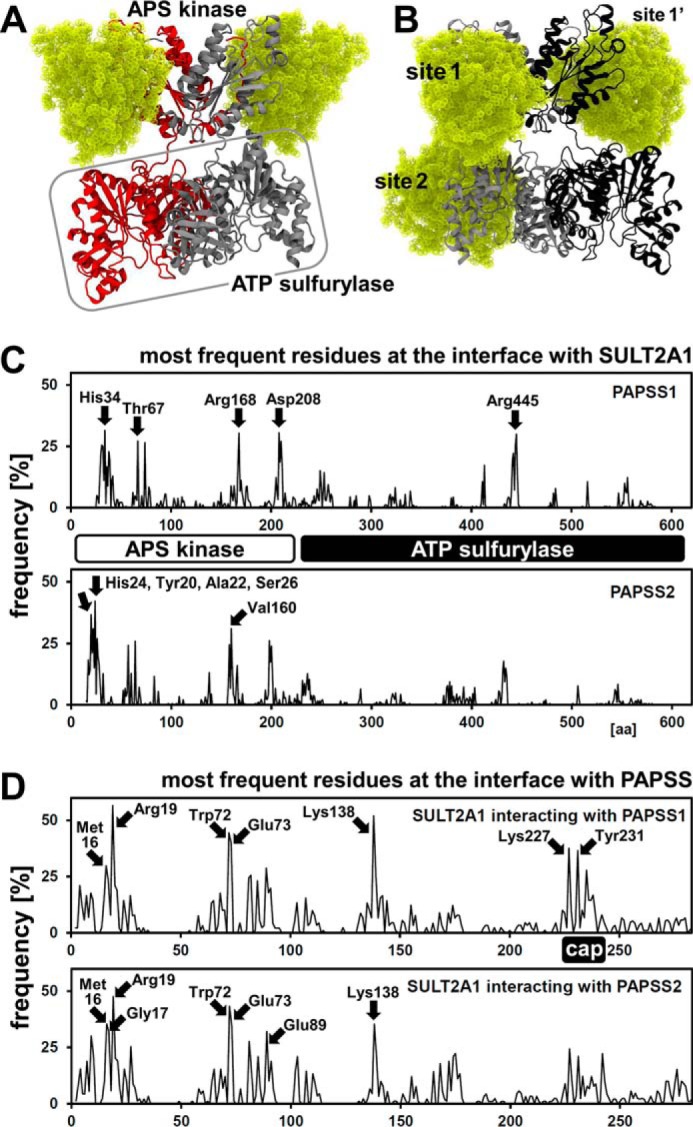
Figure 5.

SULT2A1 docks to the APS kinase domain of PAPSS2. ClusPro computational docking of three different SULT2A1 crystal structures (PDB codes 1EFH, 3F3Y, and 4IFB) to structural models of PAPSS1 and PAPSS2. A, PAPSS2–SULT2A1-docked complexes are shown. PAPSS2 APS kinase is labeled; ATP sulfurylase is labeled and boxed. The two PAPSS2 dimeric subunits are gray and red. Two SULT2A1 molecules are depicted in yellow, ball representation; contacting PAPSS2 at its APS kinase domain, sites 1 and 1′. B, corresponding representation of PAPSS1–SULT2A1 docking experiments. In addition to sites 1 and 1′, SULT2A1 contacts PAPSS1 also at the ATP sulfurylase domain. Color coding as in A, except the two PAPSS1 dimeric subunits, which are gray and black. C and D, statistical analysis of all ClusPro docking experiments, looking from the PAPS synthase side (C) and from the SULT2A1 side (D). Frequency of individual residues within 3 Å of the other protein was analyzed for PDB 1EFH, 3F3Y, and 4IFB structures separately (30 dockings each) and then averaged. Note the higher number of frequent protein contacts within the APS kinase domain of PAPSS2, compared with the one from PAPSS1. SULT2A1 contacted PAPS synthases mainly via its isoform-specific substrate binding loops; one of these is regarded as “cap.”
