
Figure 3.
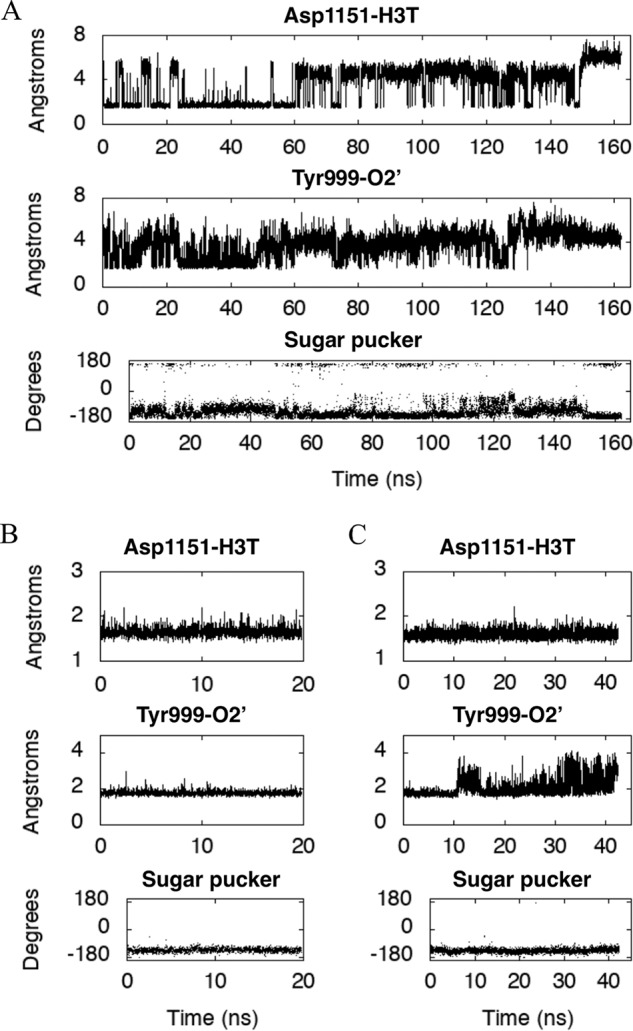
Geometric parameters characterizing the structure of our POLRMT model. Shown are the distances (Å), plotted for our model of the POLRMT complex as a function of simulation time (ns) between the acidic O atom of the Asp1151 side chain and the 3′-hydroxyl H atom H3T of the bound NTP (top panels) and between the hydroxyl H atom of the Tyr999 side chain and the 2′-hydroxyl O atom O2′ of the bound NTP (middle panels). In the bottom panels, the sugar pucker of the ribose belonging to the bound NTP is plotted as a function of simulation time (ns). The bound NTP is CTP in A, ATP in B, and GTP in C.