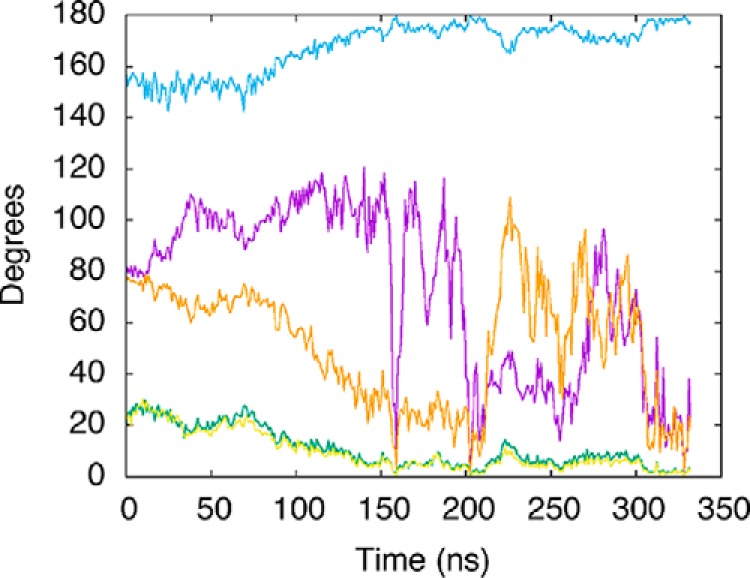
Figure 5.

Tilt of axes corresponding to a bundle of helices in the POLRMT finger subdomain. Tilt, with respect to the average axis, is plotted as a function of time for the CTP-bound POLRMT complex. These helices include the helix composed of residues 954–974 (purple line), the O-helix (residues 986–997, green line), the Y-helix (residues 1002–1016, blue line), and the helices composed of residues 1024–1044 (orange line) and 1044–1064 (yellow line).
