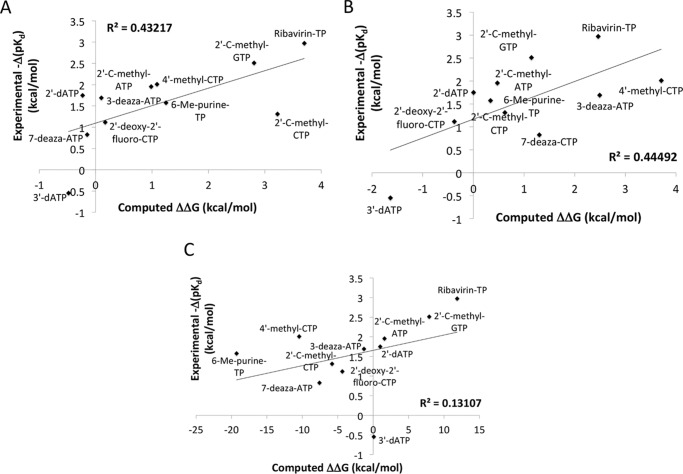
Figure 6.
Correlation between results computed using FEP or single-point energy calculations with experimental values. We show the correlation with experiment of FEP results calculated under the condition of His1125 having +1 (A) and neutral (B) charge states, respectively, and of single point free energy calculations (C). R2 values for the linear fit, or correlation, are shown on each of the three graphs. Experimental results are those of Arnold et al. (3) or in the case of 2′-C-methyl-ATP the averages of the two values reported in Ref. 55.

