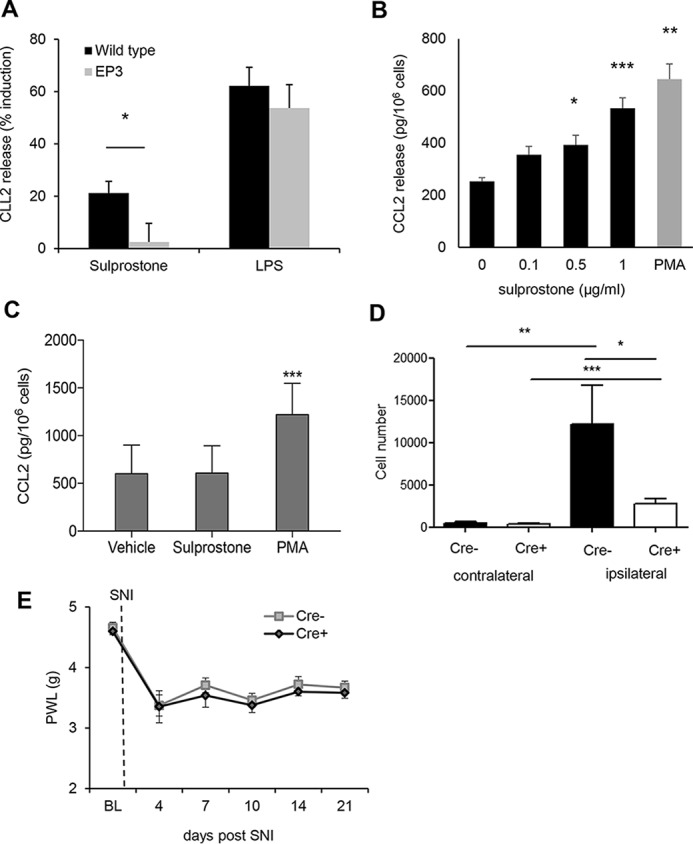
Figure 6.

EP3 activation induces the release of CCL2 from DRG neurons and mast cells. A, CCL2 release from DRG cultures of WT and EP3−/− mice was determined by ELISA after 6 h of incubation with vehicle, sulprostone (1 μg/ml), or LPS (25 ng/ml). The data are shown as means ± S.E. (WT, n = 8; EP3−/−, n = 5). *, p ≤ 0.05; Student's t test. B, CCL2 release from mast cells of WT mice was determined by ELISA after 6 h of incubation with vehicle, sulprostone or PMA (0.1 μm). The data are shown as means ± S.E. (n = 5). **, p ≤ 0.01; ***, p ≤ 0.001; ***, p ≤ 0.001; one-way ANOVA with Bonferroni multiple comparison. C, CCL2 release from mast cells of EP3−/− mice was determined by ELISA after 6 h incubation with vehicle, sulprostone (1 μg/ml), or PMA (0.1 μm). The data are shown as means ± S.E. (n = 5). ***, p ≤ 0.001; one-way ANOVA with Bonferroni multiple comparison. D, FACS analysis with cells isolated from the site of injury from WT and Mcpt5–DTA–Cre−/+ mice 14 days after the SNI operation. The data are shown as means ± S.E. (n = 5). *, p ≤ 0.05; **, p ≤ 0.01; ***, p < 0.001; two-way ANOVA/Bonferoni post hoc test. E, Cre-positive and -negative Mcpt5 DTA mice underwent SNI surgery. Mechanical thresholds were measured before surgery and at the indicated times after SNI. The data are shown as means with ± S.E. (n = 6). PWL, paw withdrawal latency.
