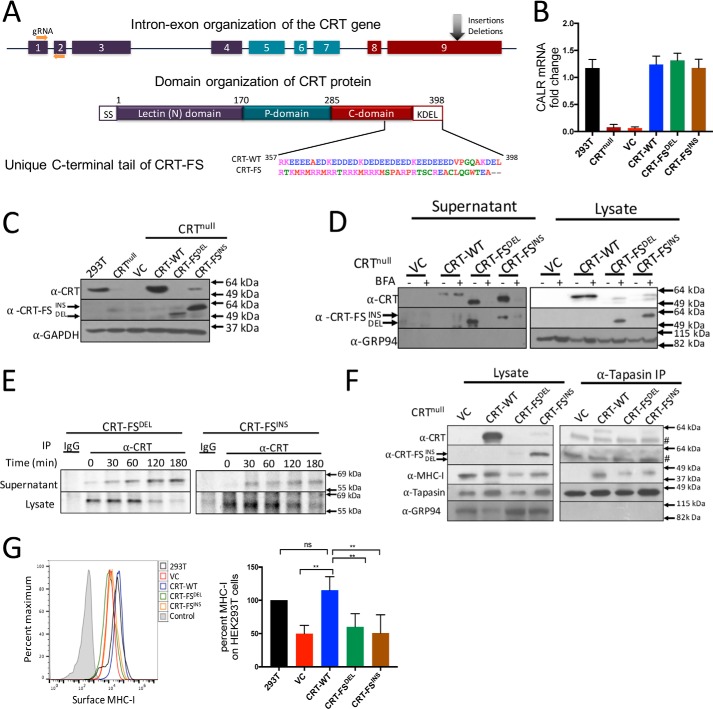
Figure 1.
Generation and characterization of CRT-null–, CRT-WT–, and CRT-FS–expressing cell lines. A, organization of the calreticulin gene and protein. Nine exons encode CRT, which is composed of an N-terminal lectin domain, a central, proline-rich P-domain, and an acidic CTD that contains an ER retention sequence, KDEL. Insertion and deletion mutants in exon 9 of the calreticulin gene lead to a +1-bp frameshift, resulting in a unique amino acid sequence of the C-terminal tail. B, CRT mRNA levels in CRT-null cells and CRT-null cells transduced with the indicated CRT constructs were assessed by qPCR via normalization to the housekeeping gene β-actin. CRT mRNA expression in HEK293T cells was used to calculate -fold change. C, Western blot analysis of expression of CRT-WT and CRT-FS in cell lysates using antibodies that recognize all forms of CRT (α-CRT) or only mutant CRT (α-CRT-FS). D, secretion of CRT was assessed by incubating cells expressing either CRT-WT or CRT-FS with 10 μg/ml BFA for 8 h, followed by Western blot analysis of CRT expression in cell lysates and culture supernatants. E, cells expressing CRT-FSDEL or CRT-FSINS were labeled with [35S]Met for 15 min followed by immunoprecipitation of CRT from the lysates or culture supernatant at the indicated time points of chase, and samples were visualized after separation on nonreducing SDS-polyacrylamide gels by autoradiography. F, interaction of CRT and MHC-I with the PLC in cells expressing CRT-WT or CRT-FS was carried out by immunoprecipitation of tapasin from cell lysates and Western blot analysis of co-immunoprecipitated proteins. #, a nonspecific band in the right panel at 49 kDa. G, MHC-I expressed on the surface of cells expressing no CRT or CRT-WT or CRT-FS was estimated by staining intact cells with the W6/32 antibody followed by FACS. Histograms from G are summarized in bar format. Qualitative data shown are a representation of at least three independent experiments. Quantitative data shown are mean ± S.D. (error bars) of three experiments. Statistical significance was evaluated using the unpaired Student's t test; *, p < 0.05; **, p < 0.01; ***, p < 0.005; ns, not significant.

