Figure 9.

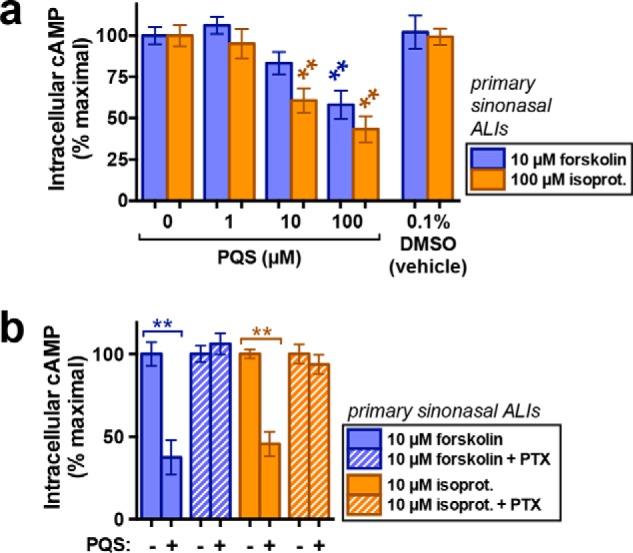
PQS decreases stimulated cAMP levels in primary sinonasal ALIs. a, bar graph of cAMP levels in forskolin-stimulated (purple) or isoproterenol (isoprot.)-stimulated (orange) ALIs measured via ELISA and normalized to forskolin or isoproterenol only (maximum stimulation for each condition); n = 6–10 ALIs for each condition. All primary ALIs used in experiments in this figure were from patients genotyped for TAS2R38 and determined to be PAV/AVI heterozygotes. Significance was determined by one-way ANOVA with Dunnett's post-test comparing each group (isoproterenol or forskolin) with the respective control (0-PQS). b, bar graph of normalized cAMP production as in a but from a separate set of cultures in the absence (solid bars) or presence of PTX (crossed bars) pretreatment (500 ng/ml; 18 h). Significance was determined by one-way ANOVA with Bonferonni post-test with paired comparisons (0 versus 100 μm PQS for each condition); n = 6–10 ALI cultures/condition from at least three different patients: **, p < 0.01. Error bars, S.E.
