
Figure 4.
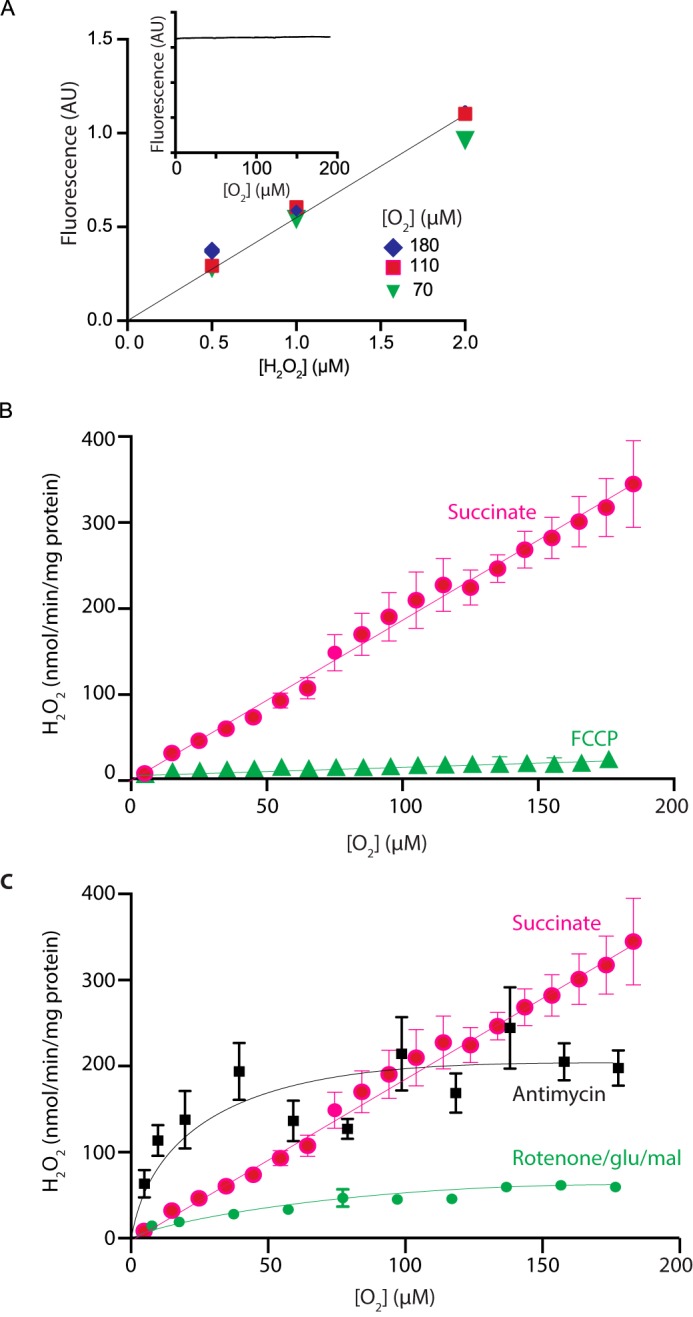
Dependence on mitochondrial H2O2 generation on [O2]. A, conversion of Amplex Red to resorufin by HRP at different [O2]. The [O2] of KCl buffer containing Amplex Red, HRP, and SOD was decreased by bubbling with N2. Then known amounts H2O2 were injected, and fluorescence was measured. The inset shows the fluorescence of resorufin (25 μm), which was added to an incubation of mitochondria respiring on succinate in the presence of rotenone (5 μm), and resorufin fluorescence was measured as the [O2] decreased due to mitochondrial respiration. B, dependence on [O2] of mitochondrial H2O2 generation by RET. Rat heart mitochondria were incubated in an oxygen electrode, and H2O2 generation was measured at various [O2] set by bubbling with N2, and ROS production was measured over a dynamic range of O2 tensions. Where indicated, 500 nm FCCP was present. Data are the mean ± S.E. (error bars). n = 11. C, comparison of [O2] dependence of different modes of mitochondrial H2O2 generation. Mitochondria were assessed as in B, except that the respiratory substrate was glutamate/malate (5 mm each) in the presence of rotenone (4 μg/ml). n = 6, or mitochondria were respiring on succinate with antimycin (1 μm) present. Data are the mean ± S.E. (n = 5) and compared with the trace from C.