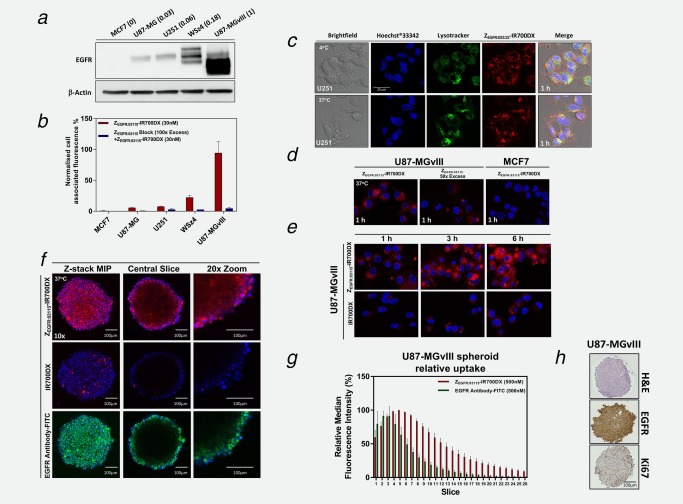
Figure 1.

Expression of EGFR in GBM cell lines and specificity of the ZEGFR:03115–IR700DX binding to EGFR. (a) Varying EGFR expression in the selected cancer cell lines was confirmed by Western blot. The numbers in the brackets represent the relative EGFR expression as determined by densitometric analysis. (b) ZEGFR:03115–IR700DX (30 nM) binding as assessed by flow cytometry in the selected cancer cells with varying EGFR expression and after blocking with 100‐fold excess of unlabeled ZEGFR:03115. Data are presented as mean ± SEM (n = 3). (c–f) Confocal microscopy images demonstrating target‐specific binding (4°C) and internalization (37°C) of either the ZEGFR:03115–IR700DX (1 µM), anti‐EGFR‐FITC antibody (25 nM for visualization purposes) or IR700DX alone (1 µM): (c) U251 cell lines (1 h incubation time), (d + e) U87‐MGvIII or MCF7 cell lines (1–6 h incubation time), (f) U87‐MGvIII spheroids (6 h incubation time). Hoechst®33342 (blue) and LysoTracker™Green DND‐26 (green) were used for counterstaining. (g) Quantification of fluorescence intensity (median fluorescence intensity) of ∼8 µm slices through U87‐MGvIII spheroids following a 6 h incubation with ZEGFR:03115–IR700DX (500 nM) or an anti‐EGFR‐FITC antibody (500 nM). Data are presented as mean ± SEM (n = 3). (h) H&E, EGFR and Ki67 immunostaining of U87‐MGvIII spheroid (400–500 µm) sections 72 h after seeding.
