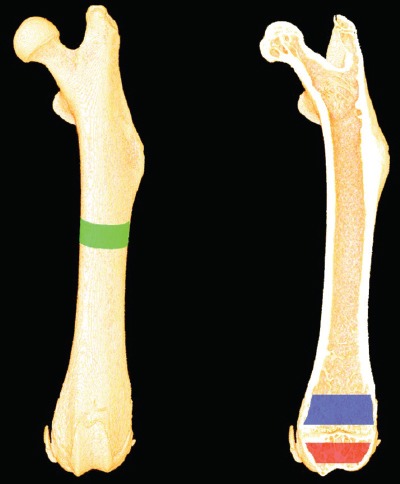
Figure 1.

Depicting the analyzed volumes of interest (VOI) from the µCT scans. The green area represents the VOI analyzed at the femoral mid-diaphysis, the blue area represents the VOI analyzed at the distal femoral metaphysis, and the red area represents the VOI analyzed at the distal femoral epiphysis.
