
Figure 6.
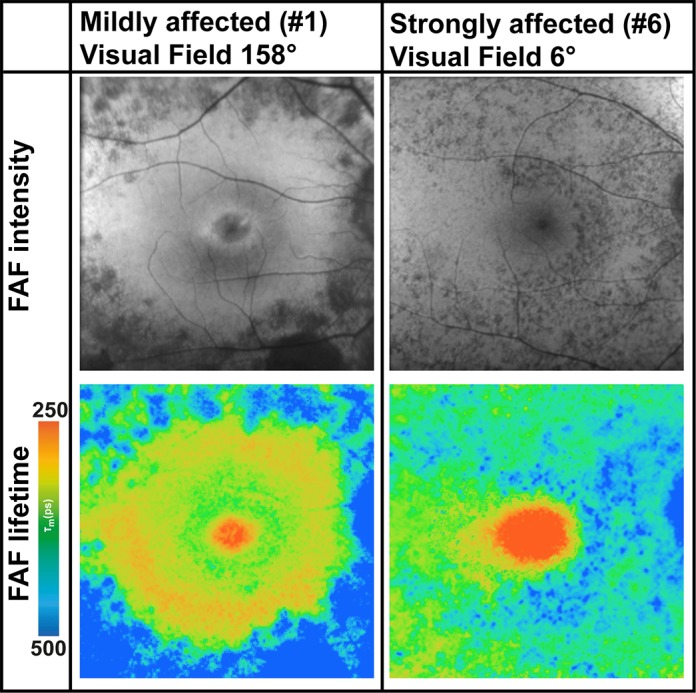
FAF intensity and lifetime images from the LSC (560–720 nm) from two subjects with different disease severities based on the visual field. Whereas patient #2 is only mildly affected, patient #6 is strongly affected.
Official websites use .gov
A
.gov website belongs to an official
government organization in the United States.
Secure .gov websites use HTTPS
A lock (
) or https:// means you've safely
connected to the .gov website. Share sensitive
information only on official, secure websites.
FAF intensity and lifetime images from the LSC (560–720 nm) from two subjects with different disease severities based on the visual field. Whereas patient #2 is only mildly affected, patient #6 is strongly affected.