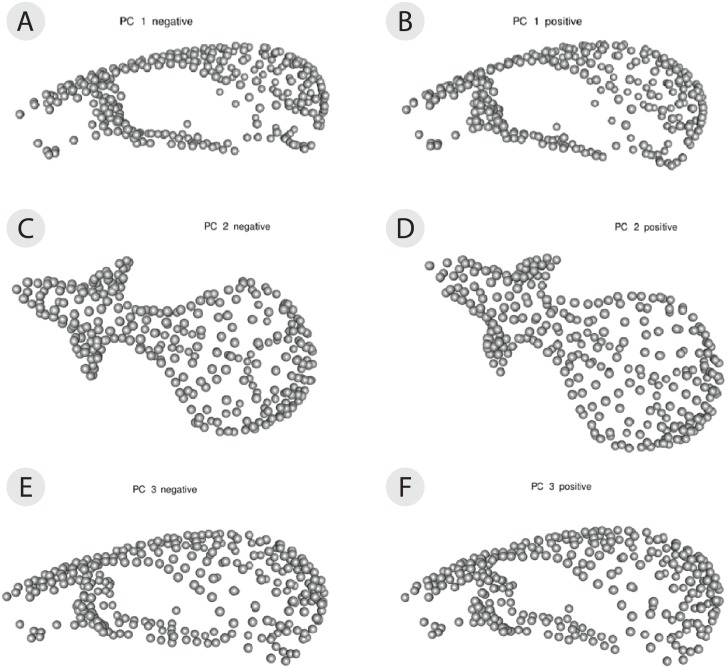
Figure 5. 3D warp-grids for the three most important principal components, showing minimum and maximum shapes for each PC.
The craniums in (A, C, and E) show the shape of the minimum negative value for each principle component (PC) and the craniums in (B, D, and F) show the shape of the maximum positive value for each PC. Compared to the minimum negative shape (A), more positive values along PC1 (26.4% variance) correspond to a larger braincase relative to the rostrum (B). Compared to the minimum negative shape (C), more positive values along PC2 (11.9% variance) correspond to a wider frontal bone (D). Compared to the minimum negative shape (E), more positive values along PC3 (8.9% variance) correspond to a more dorsally-curved ventral surface (F).

