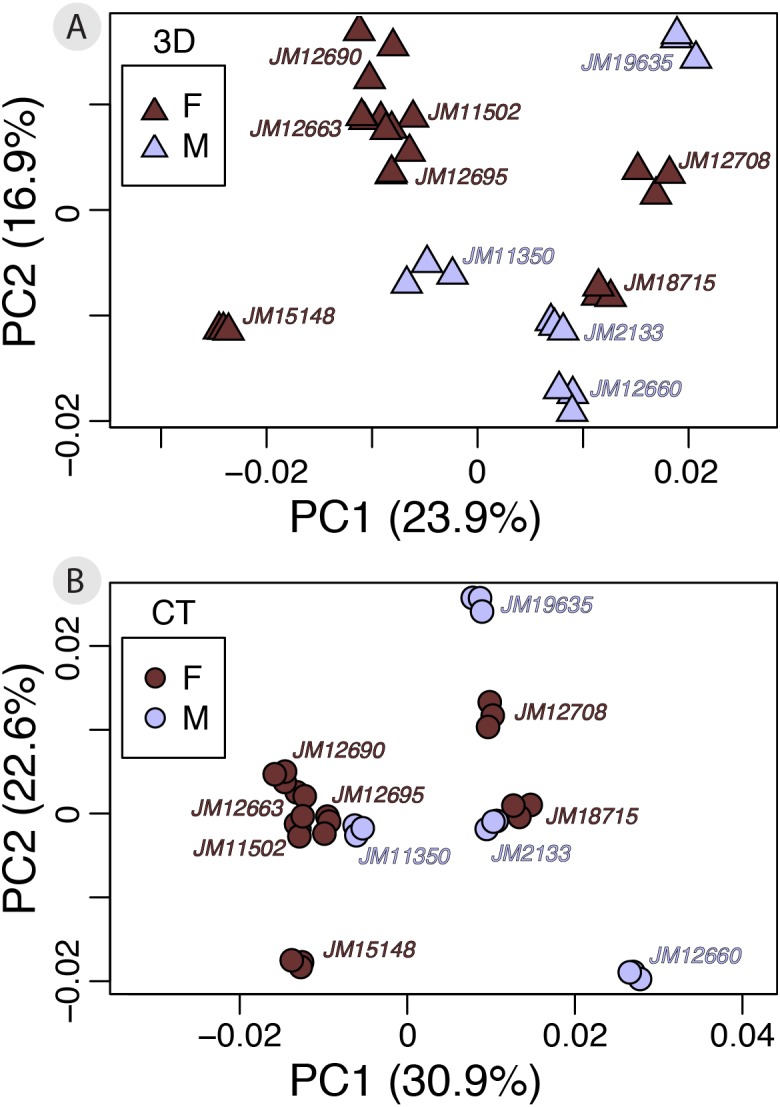
Figure 7. ntra-specific variation as shown by PCAs of 3D (A) and μCT (B) scan datasets colored by sex.

Each PCA provides an exploratory visualization of shape variation between males and females in our subsample with sex information (n = 11). Males (n = 4) are plotted in light blue and females (n = 7) are plotted in dark red. Results from the cross-validation test can be found in Table 5.
