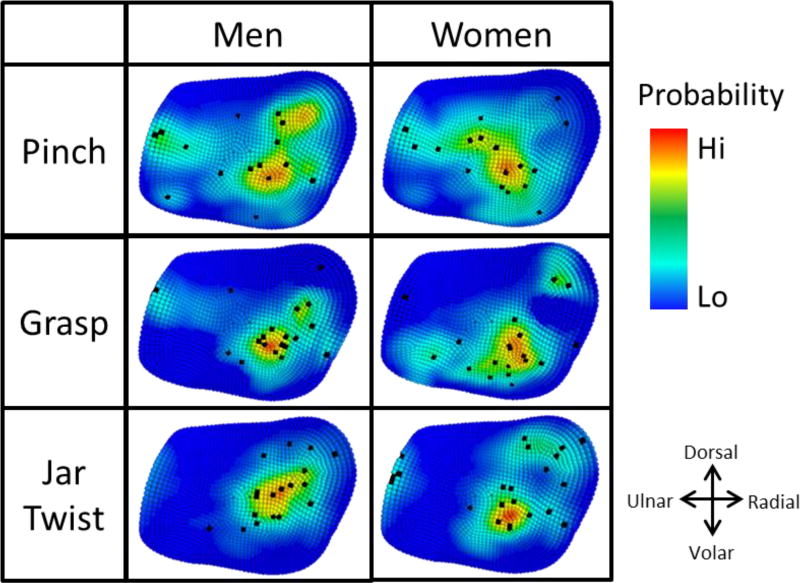
Figure 5.
Expected locations of peak cartilage stress in men and women for pinch, grasp, and jar twist, where red indicates the most likely location of peak stress and blue indicates the least likely location of peak stress. Black points indicate location of peak cartilage stresses in individual subject FE models.

