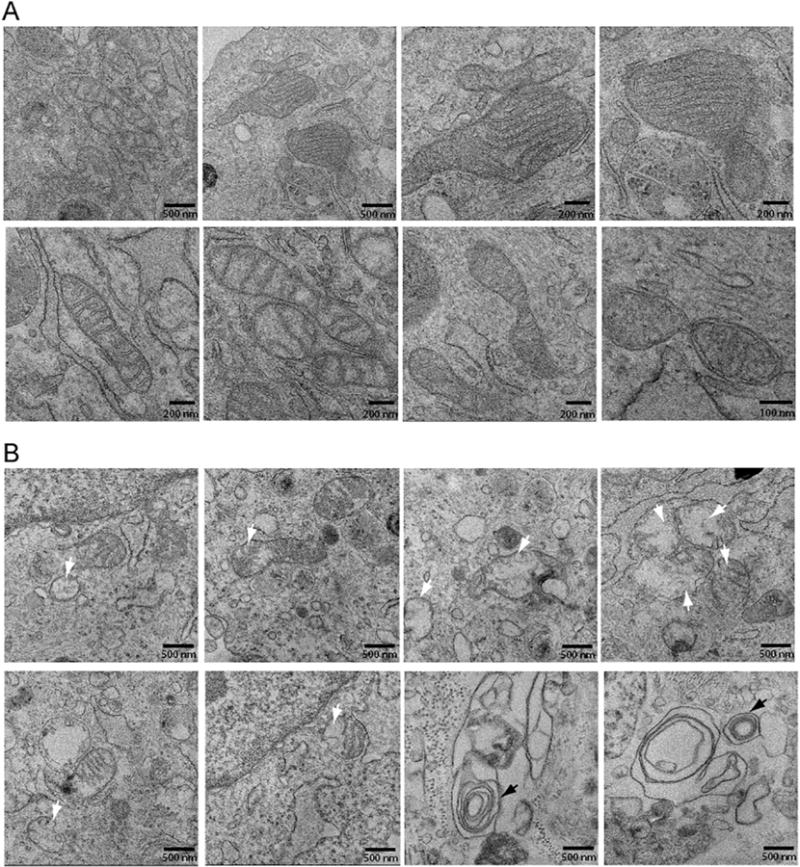
Fig. 3.

The m.8993T > G variant alters the morphology and abundance of cristae. (A) Mitochondrial morphometric analysis by transmission electron microscopy using dermal fibroblasts of the proband’s mother. The scale bar is indicated at the bottom right corner of each micrograph. (B) Mitochondrial morphometric analysis by transmission electron microscopy using dermal fibroblasts of the proband. The scale bar is indicated at the bottom right corner of each micrograph. The white arrows indicate mitochondria with abnormal cristae, while black arrows concentric cristae.
