Fig. 5.

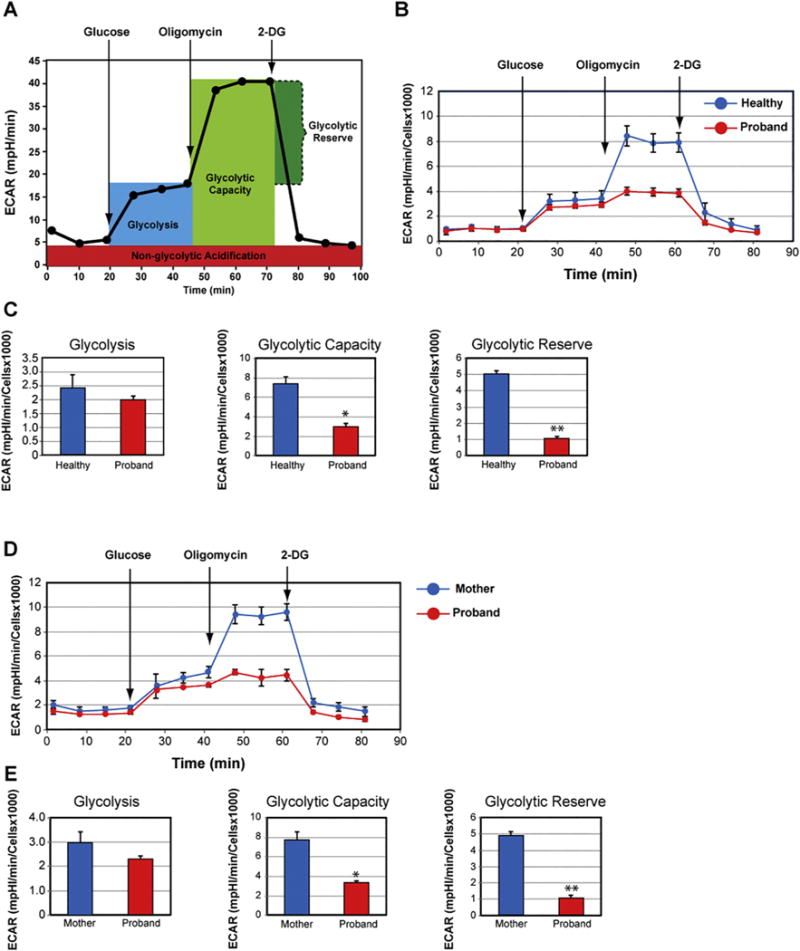
Impaired glycolytic activity in the proband’s fibroblasts. (A) Profile of the extracellular acidification rate (ECAR) adapted from the Agilent Technologies brochure of the Glycolysis Stress Test. (B) Compared ECAR responses between the proband and a healthy infant. (C) Quantitative data of glycolysis, glycolytic capacity, and glycolytic reserve. Data are represented as means ± S.D., n = 3 of independent experiments. * and ** indicate statistically significant differences with a p value of 0.0005 and 0.0001, respectively, between the proband and healthy infant. (D) Compared ECAR responses between the proband and his mother. (E) Quantitative data of glycolysis, glycolytic capacity, and glycolytic reserve. Data are represented as means ± S.D., n = 3 of independent experiments. * and ** indicate statistically significant differences with a p value of 0.0026 and 0.0005, respectively, between the proband and his mother.
