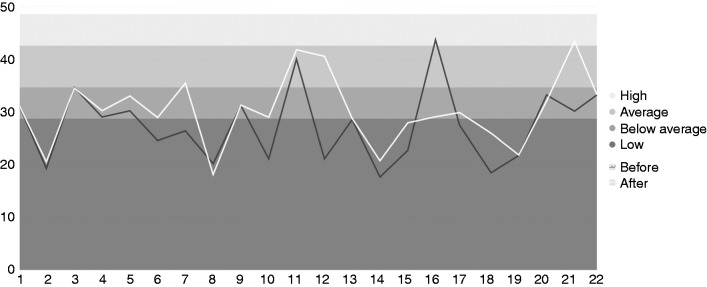
Figure 3.
Cardiovascular fitness level before and after the intervention.1,2 Participants are listed in the horizontal line, and the fitness level is listed in the vertical line. Results from the pre-test are visualised with the darker shaded line and the results from the post-test are visualised with the lighter shaded line.
1Fitness level was estimated from a sub-maximal cycle ergometer test.
2Four participants were not retested.

