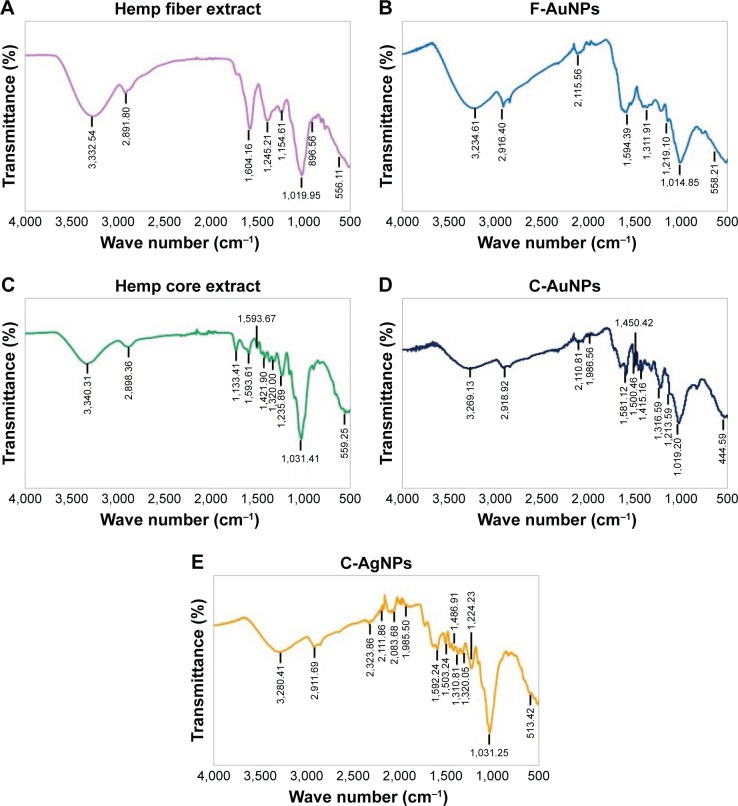
Figure 7.
FTIR spectra of biosynthesized nanoparticles and plant extract for the identification of functional groups and interactions between molecules and the nanoparticle surfaces.
Note: FTIR spectra of (A) hemp fiber extract, (B) F-AuNPs, (C) hemp core extract, (D) C-AuNPs, and (E) C-AgNPs.
Abbreviations: C-AgNPs, core–silver nanoparticles; C-AuNPs, core–gold nanoparticles; F-AuNPs, fiber–gold nanoparticles; FTIR, Fourier transform infrared.

