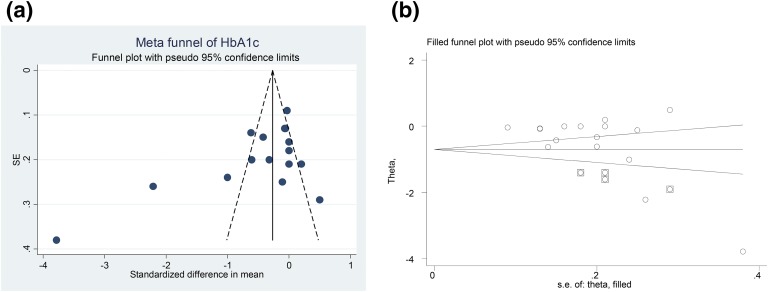
Figure 7.
(a) Funnel plot of SE by standardized mean difference for HbA1c, detailing publication bias in the studies selected for analyses. Closed circles represent observed published studies. (b) “Trim and fill” method to impute for potentially missing studies for HbA1c. Four potentially missing studies were imputed in funnel plot. Closed circles represent observed published studies. Squares with circle inside represent imputed studies.

