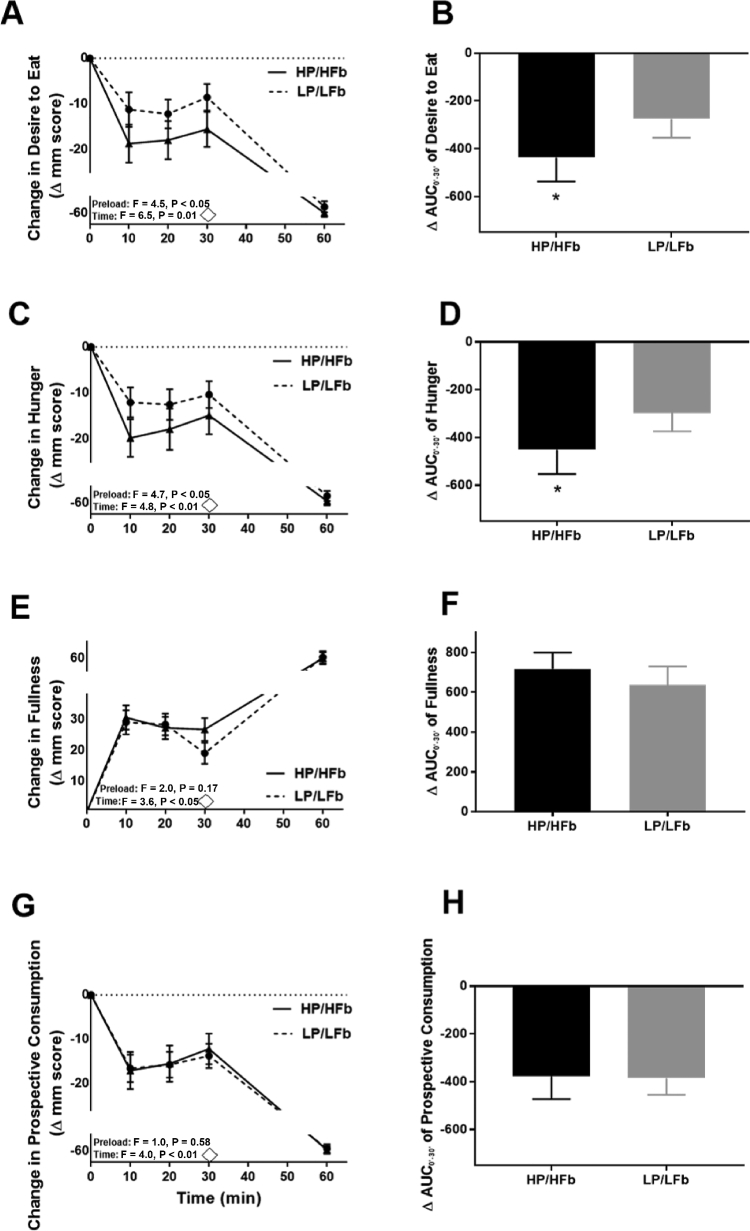
FIGURE 3.
Appetite response time course and 30 min area under the curve (AUC) change in desire to eat (A, B), hunger (C, D), fullness (E, F), and prospective consumption (G, H) following high protein/high fiber (HP/HFb) and isocaloric lower protein/lower fiber placebo (LP/LFb) preloads. ◊ Pizza meal served. Time 60 represents post-meal appetite rating. Values are mean ± SEM. * P < 0.05.

